Samoan vs Immigrants from Belize High School Diploma
COMPARE
Samoan
Immigrants from Belize
High School Diploma
High School Diploma Comparison
Samoans
Immigrants from Belize
88.5%
HIGH SCHOOL DIPLOMA
14.0/ 100
METRIC RATING
210th/ 347
METRIC RANK
84.2%
HIGH SCHOOL DIPLOMA
0.0/ 100
METRIC RATING
318th/ 347
METRIC RANK
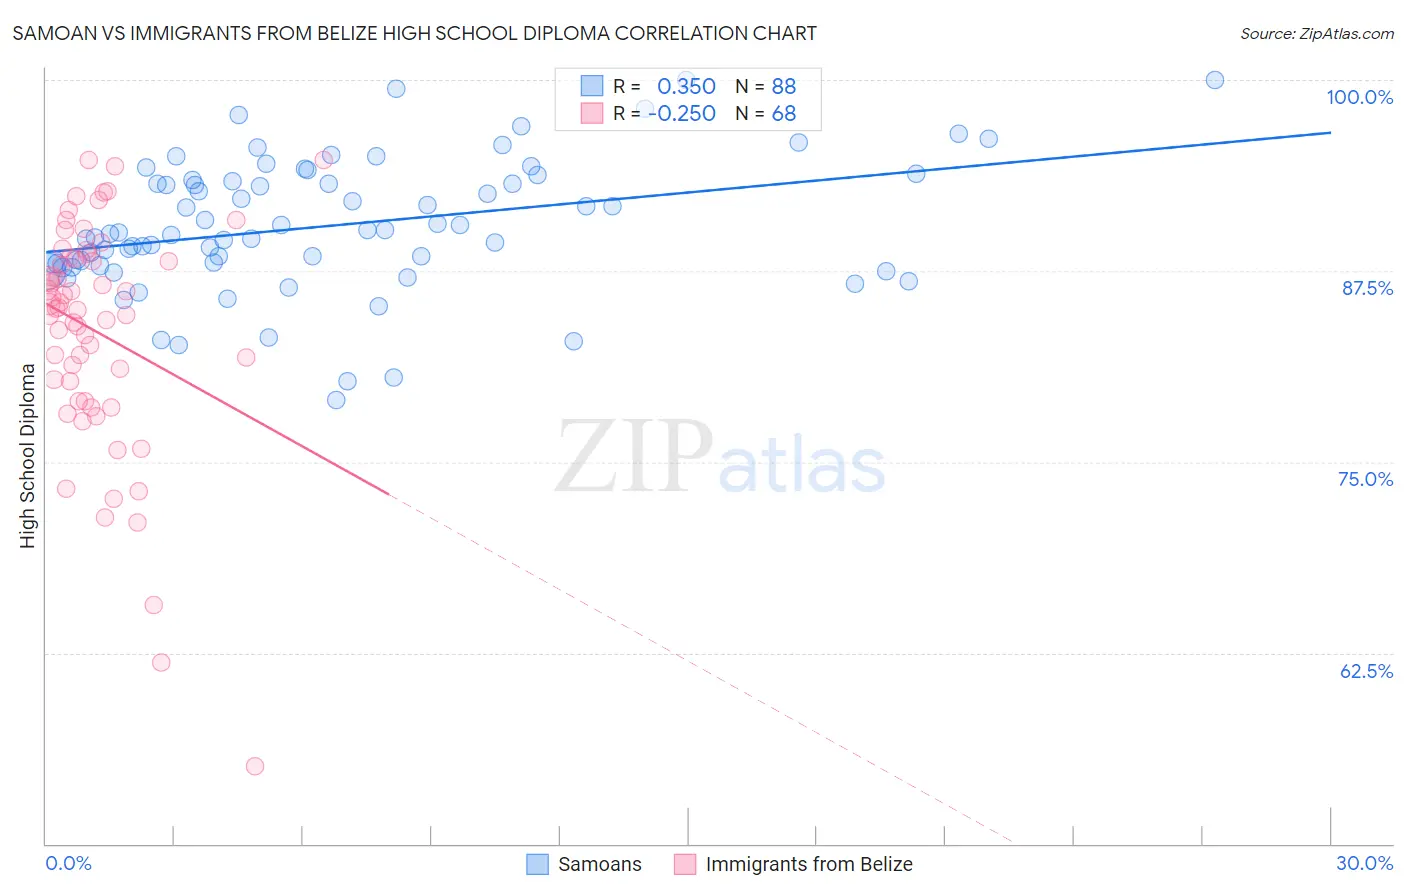
Samoan vs Immigrants from Belize High School Diploma Correlation Chart
The statistical analysis conducted on geographies consisting of 225,205,998 people shows a mild positive correlation between the proportion of Samoans and percentage of population with at least high school diploma education in the United States with a correlation coefficient (R) of 0.350 and weighted average of 88.5%. Similarly, the statistical analysis conducted on geographies consisting of 130,181,087 people shows a weak negative correlation between the proportion of Immigrants from Belize and percentage of population with at least high school diploma education in the United States with a correlation coefficient (R) of -0.250 and weighted average of 84.2%, a difference of 5.1%.
High School Diploma Correlation Summary
| Measurement | Samoan | Immigrants from Belize |
| Minimum | 79.0% | 55.0% |
| Maximum | 100.0% | 94.8% |
| Range | 21.0% | 39.7% |
| Mean | 90.5% | 83.5% |
| Median | 90.0% | 85.1% |
| Interquartile 25% (IQ1) | 87.9% | 79.6% |
| Interquartile 75% (IQ3) | 93.4% | 88.3% |
| Interquartile Range (IQR) | 5.5% | 8.7% |
| Standard Deviation (Sample) | 4.3% | 7.6% |
| Standard Deviation (Population) | 4.3% | 7.5% |
Similar Demographics by High School Diploma
Demographics Similar to Samoans by High School Diploma
In terms of high school diploma, the demographic groups most similar to Samoans are Portuguese (88.5%, a difference of 0.010%), Cherokee (88.5%, a difference of 0.010%), Inupiat (88.5%, a difference of 0.030%), Immigrants from Sierra Leone (88.6%, a difference of 0.050%), and Arapaho (88.6%, a difference of 0.060%).
| Demographics | Rating | Rank | High School Diploma |
| Somalis | 17.5 /100 | #203 | Poor 88.6% |
| Armenians | 17.2 /100 | #204 | Poor 88.6% |
| Immigrants | Micronesia | 16.4 /100 | #205 | Poor 88.6% |
| Arapaho | 16.1 /100 | #206 | Poor 88.6% |
| Immigrants | Sierra Leone | 15.8 /100 | #207 | Poor 88.6% |
| Portuguese | 14.4 /100 | #208 | Poor 88.5% |
| Cherokee | 14.3 /100 | #209 | Poor 88.5% |
| Samoans | 14.0 /100 | #210 | Poor 88.5% |
| Inupiat | 13.1 /100 | #211 | Poor 88.5% |
| South American Indians | 12.2 /100 | #212 | Poor 88.5% |
| Immigrants | Somalia | 11.3 /100 | #213 | Poor 88.4% |
| Immigrants | Cameroon | 10.9 /100 | #214 | Poor 88.4% |
| Crow | 10.9 /100 | #215 | Poor 88.4% |
| Chickasaw | 10.7 /100 | #216 | Poor 88.4% |
| Immigrants | Africa | 10.6 /100 | #217 | Poor 88.4% |
Demographics Similar to Immigrants from Belize by High School Diploma
In terms of high school diploma, the demographic groups most similar to Immigrants from Belize are Central American Indian (84.2%, a difference of 0.040%), Immigrants from Caribbean (84.3%, a difference of 0.070%), Belizean (84.3%, a difference of 0.13%), Nicaraguan (84.1%, a difference of 0.14%), and Yuman (84.0%, a difference of 0.27%).
| Demographics | Rating | Rank | High School Diploma |
| Ecuadorians | 0.0 /100 | #311 | Tragic 85.1% |
| Cape Verdeans | 0.0 /100 | #312 | Tragic 85.1% |
| Immigrants | Ecuador | 0.0 /100 | #313 | Tragic 84.8% |
| Yaqui | 0.0 /100 | #314 | Tragic 84.7% |
| Puerto Ricans | 0.0 /100 | #315 | Tragic 84.7% |
| Belizeans | 0.0 /100 | #316 | Tragic 84.3% |
| Immigrants | Caribbean | 0.0 /100 | #317 | Tragic 84.3% |
| Immigrants | Belize | 0.0 /100 | #318 | Tragic 84.2% |
| Central American Indians | 0.0 /100 | #319 | Tragic 84.2% |
| Nicaraguans | 0.0 /100 | #320 | Tragic 84.1% |
| Yuman | 0.0 /100 | #321 | Tragic 84.0% |
| Lumbee | 0.0 /100 | #322 | Tragic 83.6% |
| Immigrants | Cuba | 0.0 /100 | #323 | Tragic 83.5% |
| Immigrants | Cabo Verde | 0.0 /100 | #324 | Tragic 83.3% |
| Immigrants | Nicaragua | 0.0 /100 | #325 | Tragic 83.1% |