Samoan vs Bolivian Kindergarten
COMPARE
Samoan
Bolivian
Kindergarten
Kindergarten Comparison
Samoans
Bolivians
97.8%
KINDERGARTEN
6.9/ 100
METRIC RATING
216th/ 347
METRIC RANK
97.6%
KINDERGARTEN
1.2/ 100
METRIC RATING
244th/ 347
METRIC RANK
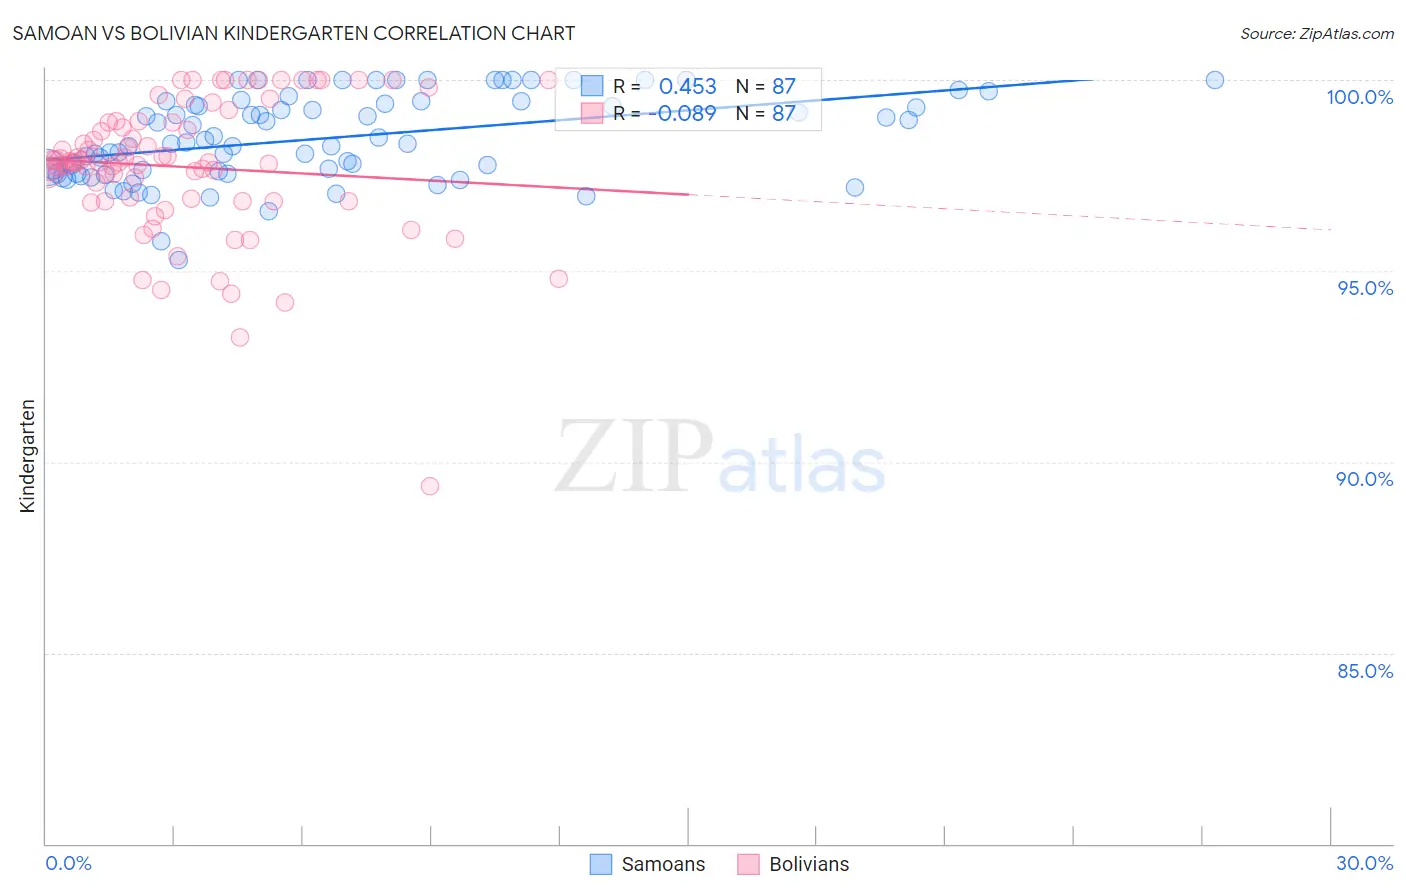
Samoan vs Bolivian Kindergarten Correlation Chart
The statistical analysis conducted on geographies consisting of 225,201,431 people shows a moderate positive correlation between the proportion of Samoans and percentage of population with at least kindergarten education in the United States with a correlation coefficient (R) of 0.453 and weighted average of 97.8%. Similarly, the statistical analysis conducted on geographies consisting of 184,667,361 people shows a slight negative correlation between the proportion of Bolivians and percentage of population with at least kindergarten education in the United States with a correlation coefficient (R) of -0.089 and weighted average of 97.6%, a difference of 0.14%.
Kindergarten Correlation Summary
| Measurement | Samoan | Bolivian |
| Minimum | 95.3% | 89.3% |
| Maximum | 100.0% | 100.0% |
| Range | 4.7% | 10.7% |
| Mean | 98.5% | 97.7% |
| Median | 98.4% | 97.8% |
| Interquartile 25% (IQ1) | 97.6% | 96.8% |
| Interquartile 75% (IQ3) | 99.4% | 98.9% |
| Interquartile Range (IQR) | 1.9% | 2.0% |
| Standard Deviation (Sample) | 1.1% | 1.8% |
| Standard Deviation (Population) | 1.1% | 1.8% |
Similar Demographics by Kindergarten
Demographics Similar to Samoans by Kindergarten
In terms of kindergarten, the demographic groups most similar to Samoans are Bahamian (97.8%, a difference of 0.0%), South American Indian (97.8%, a difference of 0.010%), Uruguayan (97.8%, a difference of 0.010%), Immigrants from Bahamas (97.8%, a difference of 0.010%), and Moroccan (97.8%, a difference of 0.020%).
| Demographics | Rating | Rank | Kindergarten |
| Costa Ricans | 11.6 /100 | #209 | Poor 97.8% |
| Immigrants | Oceania | 11.1 /100 | #210 | Poor 97.8% |
| Laotians | 10.5 /100 | #211 | Poor 97.8% |
| Moroccans | 8.9 /100 | #212 | Tragic 97.8% |
| South American Indians | 7.7 /100 | #213 | Tragic 97.8% |
| Uruguayans | 7.5 /100 | #214 | Tragic 97.8% |
| Immigrants | Bahamas | 7.4 /100 | #215 | Tragic 97.8% |
| Samoans | 6.9 /100 | #216 | Tragic 97.8% |
| Bahamians | 6.6 /100 | #217 | Tragic 97.8% |
| Immigrants | Morocco | 5.4 /100 | #218 | Tragic 97.7% |
| Immigrants | Panama | 5.0 /100 | #219 | Tragic 97.7% |
| Tongans | 4.8 /100 | #220 | Tragic 97.7% |
| Immigrants | Zaire | 4.5 /100 | #221 | Tragic 97.7% |
| Immigrants | Sudan | 4.5 /100 | #222 | Tragic 97.7% |
| Immigrants | Syria | 4.3 /100 | #223 | Tragic 97.7% |
Demographics Similar to Bolivians by Kindergarten
In terms of kindergarten, the demographic groups most similar to Bolivians are Asian (97.6%, a difference of 0.0%), Liberian (97.6%, a difference of 0.010%), Immigrants from Indonesia (97.6%, a difference of 0.010%), South American (97.6%, a difference of 0.010%), and Indian (Asian) (97.6%, a difference of 0.010%).
| Demographics | Rating | Rank | Kindergarten |
| Nigerians | 1.8 /100 | #237 | Tragic 97.6% |
| Immigrants | Eastern Asia | 1.7 /100 | #238 | Tragic 97.6% |
| U.S. Virgin Islanders | 1.7 /100 | #239 | Tragic 97.6% |
| Koreans | 1.6 /100 | #240 | Tragic 97.6% |
| Liberians | 1.3 /100 | #241 | Tragic 97.6% |
| Immigrants | Indonesia | 1.3 /100 | #242 | Tragic 97.6% |
| Asians | 1.2 /100 | #243 | Tragic 97.6% |
| Bolivians | 1.2 /100 | #244 | Tragic 97.6% |
| South Americans | 1.1 /100 | #245 | Tragic 97.6% |
| Indians (Asian) | 1.0 /100 | #246 | Tragic 97.6% |
| Immigrants | Eastern Africa | 1.0 /100 | #247 | Tragic 97.6% |
| Immigrants | Middle Africa | 1.0 /100 | #248 | Tragic 97.6% |
| Peruvians | 1.0 /100 | #249 | Tragic 97.6% |
| Immigrants | Senegal | 0.9 /100 | #250 | Tragic 97.6% |
| Ethiopians | 0.9 /100 | #251 | Tragic 97.6% |