Salvadoran vs Immigrants from Southern Europe 10th Grade
COMPARE
Salvadoran
Immigrants from Southern Europe
10th Grade
10th Grade Comparison
Salvadorans
Immigrants from Southern Europe
87.5%
10TH GRADE
0.0/ 100
METRIC RATING
341st/ 347
METRIC RANK
93.2%
10TH GRADE
8.9/ 100
METRIC RATING
221st/ 347
METRIC RANK
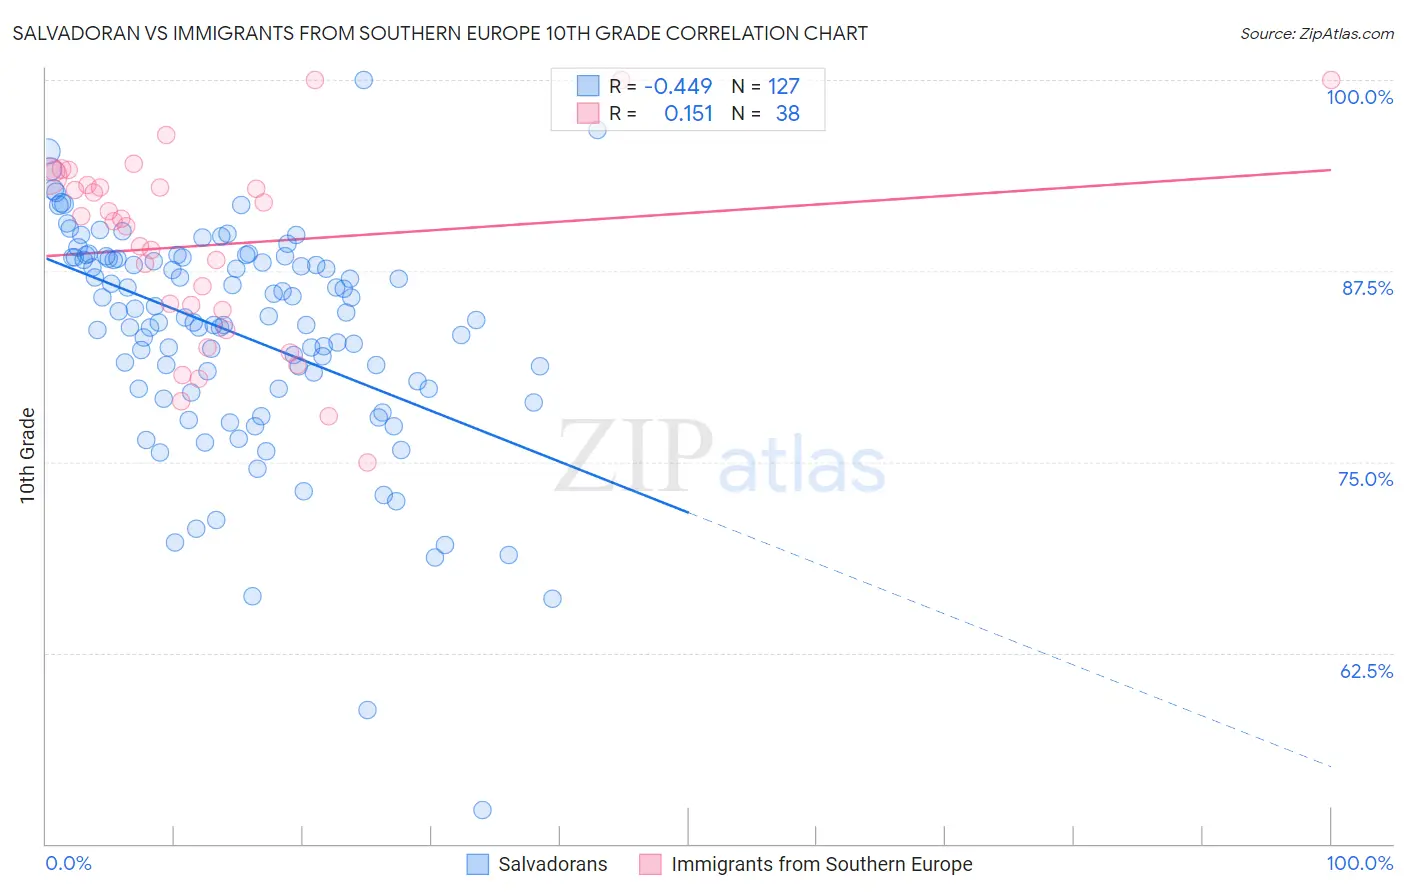
Salvadoran vs Immigrants from Southern Europe 10th Grade Correlation Chart
The statistical analysis conducted on geographies consisting of 399,034,410 people shows a moderate negative correlation between the proportion of Salvadorans and percentage of population with at least 10th grade education in the United States with a correlation coefficient (R) of -0.449 and weighted average of 87.5%. Similarly, the statistical analysis conducted on geographies consisting of 402,804,595 people shows a poor positive correlation between the proportion of Immigrants from Southern Europe and percentage of population with at least 10th grade education in the United States with a correlation coefficient (R) of 0.151 and weighted average of 93.2%, a difference of 6.5%.
10th Grade Correlation Summary
| Measurement | Salvadoran | Immigrants from Southern Europe |
| Minimum | 52.2% | 75.0% |
| Maximum | 100.0% | 100.0% |
| Range | 47.8% | 25.0% |
| Mean | 83.4% | 89.2% |
| Median | 84.5% | 90.8% |
| Interquartile 25% (IQ1) | 79.8% | 85.0% |
| Interquartile 75% (IQ3) | 88.3% | 93.1% |
| Interquartile Range (IQR) | 8.5% | 8.1% |
| Standard Deviation (Sample) | 7.3% | 6.3% |
| Standard Deviation (Population) | 7.3% | 6.2% |
Similar Demographics by 10th Grade
Demographics Similar to Salvadorans by 10th Grade
In terms of 10th grade, the demographic groups most similar to Salvadorans are Immigrants from Guatemala (87.4%, a difference of 0.16%), Mexican (87.8%, a difference of 0.29%), Guatemalan (87.9%, a difference of 0.44%), Yakama (86.9%, a difference of 0.74%), and Immigrants from El Salvador (86.8%, a difference of 0.88%).
| Demographics | Rating | Rank | 10th Grade |
| Hondurans | 0.0 /100 | #333 | Tragic 89.0% |
| Hispanics or Latinos | 0.0 /100 | #334 | Tragic 88.9% |
| Immigrants | Dominican Republic | 0.0 /100 | #335 | Tragic 88.7% |
| Immigrants | Honduras | 0.0 /100 | #336 | Tragic 88.5% |
| Central Americans | 0.0 /100 | #337 | Tragic 88.4% |
| Immigrants | Latin America | 0.0 /100 | #338 | Tragic 88.3% |
| Guatemalans | 0.0 /100 | #339 | Tragic 87.9% |
| Mexicans | 0.0 /100 | #340 | Tragic 87.8% |
| Salvadorans | 0.0 /100 | #341 | Tragic 87.5% |
| Immigrants | Guatemala | 0.0 /100 | #342 | Tragic 87.4% |
| Yakama | 0.0 /100 | #343 | Tragic 86.9% |
| Immigrants | El Salvador | 0.0 /100 | #344 | Tragic 86.8% |
| Immigrants | Central America | 0.0 /100 | #345 | Tragic 86.6% |
| Spanish American Indians | 0.0 /100 | #346 | Tragic 86.2% |
| Immigrants | Mexico | 0.0 /100 | #347 | Tragic 86.2% |
Demographics Similar to Immigrants from Southern Europe by 10th Grade
In terms of 10th grade, the demographic groups most similar to Immigrants from Southern Europe are Tongan (93.3%, a difference of 0.020%), Ethiopian (93.2%, a difference of 0.030%), Immigrants from Liberia (93.3%, a difference of 0.040%), Seminole (93.3%, a difference of 0.040%), and Immigrants from Sierra Leone (93.2%, a difference of 0.040%).
| Demographics | Rating | Rank | 10th Grade |
| Immigrants | Bahamas | 15.2 /100 | #214 | Poor 93.4% |
| Immigrants | Oceania | 15.1 /100 | #215 | Poor 93.4% |
| Immigrants | Eastern Africa | 14.7 /100 | #216 | Poor 93.4% |
| Portuguese | 12.1 /100 | #217 | Poor 93.3% |
| Immigrants | Liberia | 10.2 /100 | #218 | Poor 93.3% |
| Seminole | 10.2 /100 | #219 | Poor 93.3% |
| Tongans | 9.5 /100 | #220 | Tragic 93.3% |
| Immigrants | Southern Europe | 8.9 /100 | #221 | Tragic 93.2% |
| Ethiopians | 7.9 /100 | #222 | Tragic 93.2% |
| Immigrants | Sierra Leone | 7.6 /100 | #223 | Tragic 93.2% |
| Bolivians | 6.7 /100 | #224 | Tragic 93.2% |
| Somalis | 6.2 /100 | #225 | Tragic 93.2% |
| Koreans | 6.1 /100 | #226 | Tragic 93.2% |
| Blacks/African Americans | 6.0 /100 | #227 | Tragic 93.2% |
| Immigrants | China | 5.9 /100 | #228 | Tragic 93.2% |