Salvadoran vs Immigrants from England 12th Grade, No Diploma
COMPARE
Salvadoran
Immigrants from England
12th Grade, No Diploma
12th Grade, No Diploma Comparison
Salvadorans
Immigrants from England
84.5%
12TH GRADE, NO DIPLOMA
0.0/ 100
METRIC RATING
339th/ 347
METRIC RANK
92.6%
12TH GRADE, NO DIPLOMA
99.4/ 100
METRIC RATING
77th/ 347
METRIC RANK
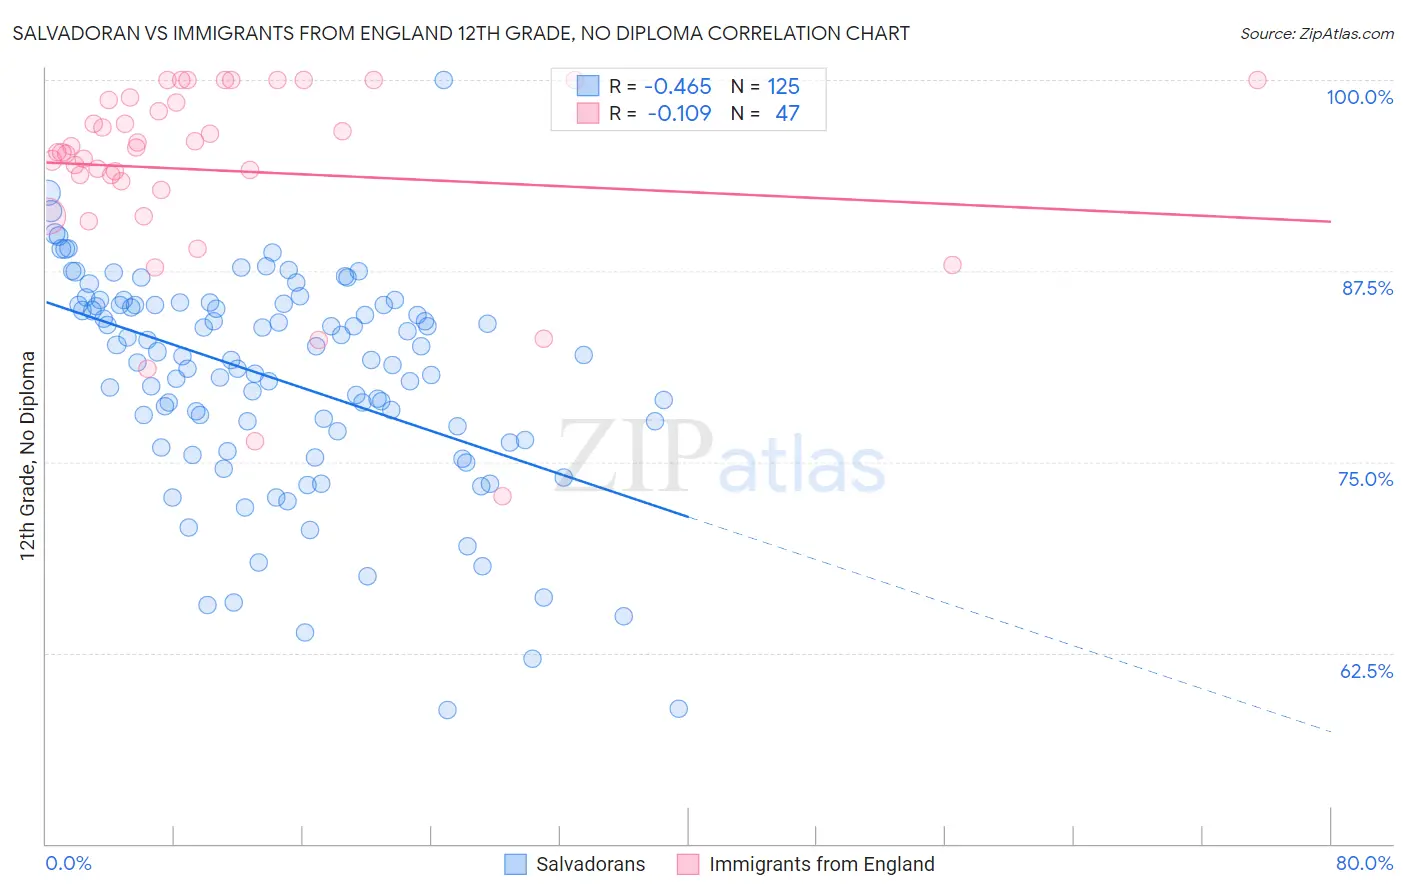
Salvadoran vs Immigrants from England 12th Grade, No Diploma Correlation Chart
The statistical analysis conducted on geographies consisting of 399,020,036 people shows a moderate negative correlation between the proportion of Salvadorans and percentage of population with at least 12th grade (no diploma) education in the United States with a correlation coefficient (R) of -0.465 and weighted average of 84.5%. Similarly, the statistical analysis conducted on geographies consisting of 391,897,700 people shows a poor negative correlation between the proportion of Immigrants from England and percentage of population with at least 12th grade (no diploma) education in the United States with a correlation coefficient (R) of -0.109 and weighted average of 92.6%, a difference of 9.6%.
12th Grade, No Diploma Correlation Summary
| Measurement | Salvadoran | Immigrants from England |
| Minimum | 58.8% | 72.7% |
| Maximum | 100.0% | 100.0% |
| Range | 41.2% | 27.3% |
| Mean | 80.4% | 94.1% |
| Median | 81.7% | 95.3% |
| Interquartile 25% (IQ1) | 76.4% | 92.8% |
| Interquartile 75% (IQ3) | 85.3% | 98.7% |
| Interquartile Range (IQR) | 8.9% | 5.9% |
| Standard Deviation (Sample) | 7.2% | 6.3% |
| Standard Deviation (Population) | 7.1% | 6.2% |
Similar Demographics by 12th Grade, No Diploma
Demographics Similar to Salvadorans by 12th Grade, No Diploma
In terms of 12th grade, no diploma, the demographic groups most similar to Salvadorans are Guatemalan (84.6%, a difference of 0.10%), Pima (84.6%, a difference of 0.14%), Tohono O'odham (84.7%, a difference of 0.27%), Mexican (84.1%, a difference of 0.41%), and Immigrants from Yemen (84.8%, a difference of 0.42%).
| Demographics | Rating | Rank | 12th Grade, No Diploma |
| Immigrants | Honduras | 0.0 /100 | #332 | Tragic 85.0% |
| Immigrants | Latin America | 0.0 /100 | #333 | Tragic 85.0% |
| Immigrants | Dominican Republic | 0.0 /100 | #334 | Tragic 84.9% |
| Immigrants | Yemen | 0.0 /100 | #335 | Tragic 84.8% |
| Tohono O'odham | 0.0 /100 | #336 | Tragic 84.7% |
| Pima | 0.0 /100 | #337 | Tragic 84.6% |
| Guatemalans | 0.0 /100 | #338 | Tragic 84.6% |
| Salvadorans | 0.0 /100 | #339 | Tragic 84.5% |
| Mexicans | 0.0 /100 | #340 | Tragic 84.1% |
| Immigrants | Guatemala | 0.0 /100 | #341 | Tragic 84.0% |
| Houma | 0.0 /100 | #342 | Tragic 83.7% |
| Immigrants | El Salvador | 0.0 /100 | #343 | Tragic 83.6% |
| Immigrants | Central America | 0.0 /100 | #344 | Tragic 83.0% |
| Spanish American Indians | 0.0 /100 | #345 | Tragic 82.9% |
| Yakama | 0.0 /100 | #346 | Tragic 82.5% |
Demographics Similar to Immigrants from England by 12th Grade, No Diploma
In terms of 12th grade, no diploma, the demographic groups most similar to Immigrants from England are Burmese (92.6%, a difference of 0.020%), Immigrants from Moldova (92.6%, a difference of 0.020%), Native Hawaiian (92.6%, a difference of 0.020%), French (92.6%, a difference of 0.020%), and Immigrants from South Central Asia (92.6%, a difference of 0.030%).
| Demographics | Rating | Rank | 12th Grade, No Diploma |
| Czechoslovakians | 99.5 /100 | #70 | Exceptional 92.6% |
| Immigrants | Latvia | 99.5 /100 | #71 | Exceptional 92.6% |
| Immigrants | South Central Asia | 99.5 /100 | #72 | Exceptional 92.6% |
| Burmese | 99.4 /100 | #73 | Exceptional 92.6% |
| Immigrants | Moldova | 99.4 /100 | #74 | Exceptional 92.6% |
| Native Hawaiians | 99.4 /100 | #75 | Exceptional 92.6% |
| French | 99.4 /100 | #76 | Exceptional 92.6% |
| Immigrants | England | 99.4 /100 | #77 | Exceptional 92.6% |
| Cambodians | 99.3 /100 | #78 | Exceptional 92.6% |
| Romanians | 99.3 /100 | #79 | Exceptional 92.6% |
| French Canadians | 99.3 /100 | #80 | Exceptional 92.6% |
| Immigrants | Denmark | 99.2 /100 | #81 | Exceptional 92.5% |
| Immigrants | Switzerland | 99.2 /100 | #82 | Exceptional 92.5% |
| Immigrants | Israel | 99.2 /100 | #83 | Exceptional 92.5% |
| Immigrants | Bulgaria | 99.1 /100 | #84 | Exceptional 92.5% |