Salvadoran vs Immigrants from Afghanistan High School Diploma
COMPARE
Salvadoran
Immigrants from Afghanistan
High School Diploma
High School Diploma Comparison
Salvadorans
Immigrants from Afghanistan
81.7%
HIGH SCHOOL DIPLOMA
0.0/ 100
METRIC RATING
338th/ 347
METRIC RANK
88.3%
HIGH SCHOOL DIPLOMA
8.6/ 100
METRIC RATING
221st/ 347
METRIC RANK
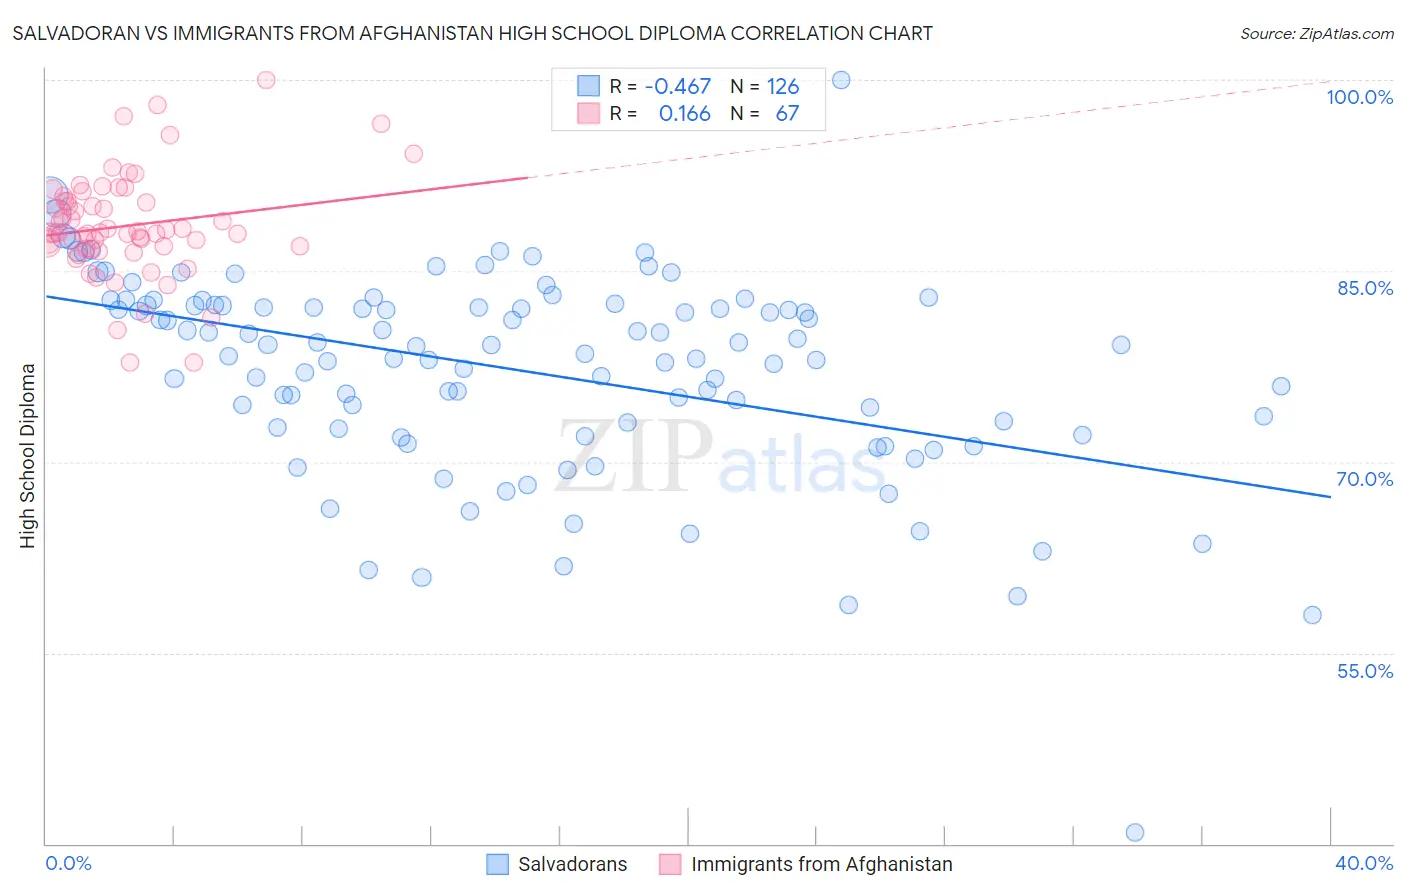
Salvadoran vs Immigrants from Afghanistan High School Diploma Correlation Chart
The statistical analysis conducted on geographies consisting of 399,034,198 people shows a moderate negative correlation between the proportion of Salvadorans and percentage of population with at least high school diploma education in the United States with a correlation coefficient (R) of -0.467 and weighted average of 81.7%. Similarly, the statistical analysis conducted on geographies consisting of 147,629,579 people shows a poor positive correlation between the proportion of Immigrants from Afghanistan and percentage of population with at least high school diploma education in the United States with a correlation coefficient (R) of 0.166 and weighted average of 88.3%, a difference of 8.2%.
High School Diploma Correlation Summary
| Measurement | Salvadoran | Immigrants from Afghanistan |
| Minimum | 40.9% | 77.8% |
| Maximum | 100.0% | 100.0% |
| Range | 59.1% | 22.2% |
| Mean | 77.2% | 88.5% |
| Median | 79.1% | 88.0% |
| Interquartile 25% (IQ1) | 72.7% | 86.8% |
| Interquartile 75% (IQ3) | 82.3% | 90.5% |
| Interquartile Range (IQR) | 9.6% | 3.7% |
| Standard Deviation (Sample) | 8.1% | 4.1% |
| Standard Deviation (Population) | 8.1% | 4.1% |
Similar Demographics by High School Diploma
Demographics Similar to Salvadorans by High School Diploma
In terms of high school diploma, the demographic groups most similar to Salvadorans are Pima (81.6%, a difference of 0.10%), Immigrants from Yemen (81.8%, a difference of 0.17%), Houma (81.5%, a difference of 0.20%), Immigrants from Dominican Republic (82.0%, a difference of 0.32%), and Guatemalan (82.0%, a difference of 0.33%).
| Demographics | Rating | Rank | High School Diploma |
| Central Americans | 0.0 /100 | #331 | Tragic 82.5% |
| Immigrants | Honduras | 0.0 /100 | #332 | Tragic 82.5% |
| Immigrants | Latin America | 0.0 /100 | #333 | Tragic 82.1% |
| Tohono O'odham | 0.0 /100 | #334 | Tragic 82.1% |
| Guatemalans | 0.0 /100 | #335 | Tragic 82.0% |
| Immigrants | Dominican Republic | 0.0 /100 | #336 | Tragic 82.0% |
| Immigrants | Yemen | 0.0 /100 | #337 | Tragic 81.8% |
| Salvadorans | 0.0 /100 | #338 | Tragic 81.7% |
| Pima | 0.0 /100 | #339 | Tragic 81.6% |
| Houma | 0.0 /100 | #340 | Tragic 81.5% |
| Mexicans | 0.0 /100 | #341 | Tragic 81.4% |
| Immigrants | Guatemala | 0.0 /100 | #342 | Tragic 81.4% |
| Immigrants | El Salvador | 0.0 /100 | #343 | Tragic 80.8% |
| Immigrants | Central America | 0.0 /100 | #344 | Tragic 80.1% |
| Yakama | 0.0 /100 | #345 | Tragic 80.0% |
Demographics Similar to Immigrants from Afghanistan by High School Diploma
In terms of high school diploma, the demographic groups most similar to Immigrants from Afghanistan are Tongan (88.4%, a difference of 0.040%), Colville (88.3%, a difference of 0.040%), Costa Rican (88.4%, a difference of 0.050%), Immigrants from Zaire (88.3%, a difference of 0.050%), and Immigrants from Bolivia (88.4%, a difference of 0.070%).
| Demographics | Rating | Rank | High School Diploma |
| Immigrants | Cameroon | 10.9 /100 | #214 | Poor 88.4% |
| Crow | 10.9 /100 | #215 | Poor 88.4% |
| Chickasaw | 10.7 /100 | #216 | Poor 88.4% |
| Immigrants | Africa | 10.6 /100 | #217 | Poor 88.4% |
| Immigrants | Bolivia | 10.3 /100 | #218 | Poor 88.4% |
| Costa Ricans | 9.6 /100 | #219 | Tragic 88.4% |
| Tongans | 9.5 /100 | #220 | Tragic 88.4% |
| Immigrants | Afghanistan | 8.6 /100 | #221 | Tragic 88.3% |
| Colville | 7.8 /100 | #222 | Tragic 88.3% |
| Immigrants | Zaire | 7.6 /100 | #223 | Tragic 88.3% |
| Shoshone | 7.0 /100 | #224 | Tragic 88.3% |
| Creek | 6.9 /100 | #225 | Tragic 88.3% |
| Uruguayans | 5.6 /100 | #226 | Tragic 88.2% |
| Immigrants | Liberia | 5.5 /100 | #227 | Tragic 88.2% |
| Kiowa | 5.3 /100 | #228 | Tragic 88.2% |