Salvadoran vs Hispanic or Latino Professional Degree
COMPARE
Salvadoran
Hispanic or Latino
Professional Degree
Professional Degree Comparison
Salvadorans
Hispanics or Latinos
3.5%
PROFESSIONAL DEGREE
0.4/ 100
METRIC RATING
284th/ 347
METRIC RANK
3.2%
PROFESSIONAL DEGREE
0.0/ 100
METRIC RATING
322nd/ 347
METRIC RANK
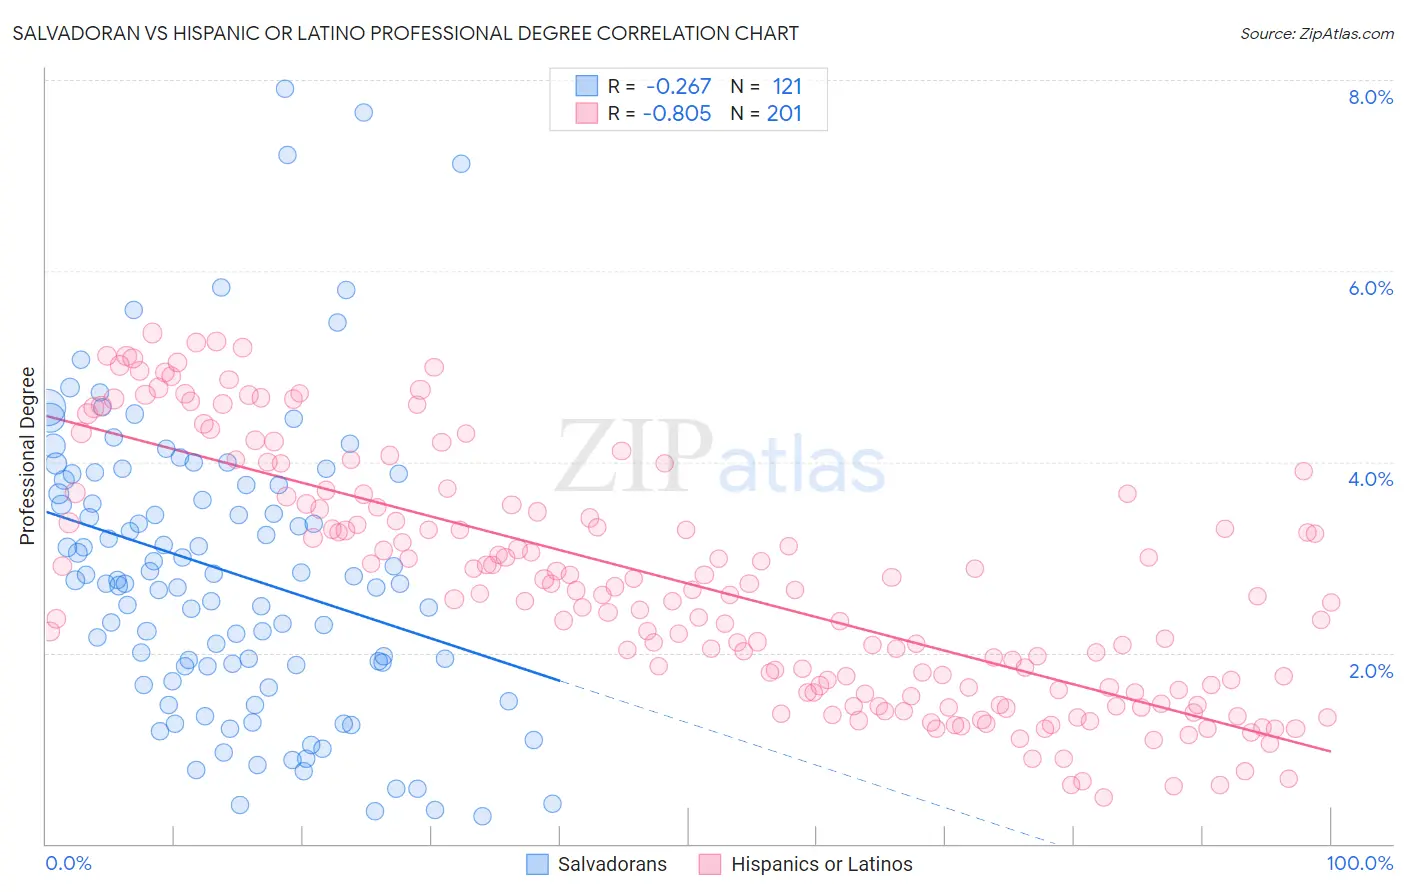
Salvadoran vs Hispanic or Latino Professional Degree Correlation Chart
The statistical analysis conducted on geographies consisting of 397,494,497 people shows a weak negative correlation between the proportion of Salvadorans and percentage of population with at least professional degree education in the United States with a correlation coefficient (R) of -0.267 and weighted average of 3.5%. Similarly, the statistical analysis conducted on geographies consisting of 568,625,989 people shows a very strong negative correlation between the proportion of Hispanics or Latinos and percentage of population with at least professional degree education in the United States with a correlation coefficient (R) of -0.805 and weighted average of 3.2%, a difference of 11.4%.
Professional Degree Correlation Summary
| Measurement | Salvadoran | Hispanic or Latino |
| Minimum | 0.29% | 0.49% |
| Maximum | 7.9% | 5.3% |
| Range | 7.6% | 4.9% |
| Mean | 2.8% | 2.7% |
| Median | 2.8% | 2.6% |
| Interquartile 25% (IQ1) | 1.9% | 1.6% |
| Interquartile 75% (IQ3) | 3.8% | 3.6% |
| Interquartile Range (IQR) | 1.9% | 2.0% |
| Standard Deviation (Sample) | 1.5% | 1.3% |
| Standard Deviation (Population) | 1.5% | 1.3% |
Similar Demographics by Professional Degree
Demographics Similar to Salvadorans by Professional Degree
In terms of professional degree, the demographic groups most similar to Salvadorans are Comanche (3.5%, a difference of 0.10%), Immigrants from Caribbean (3.5%, a difference of 0.40%), Apache (3.5%, a difference of 0.42%), Dominican (3.5%, a difference of 0.45%), and Immigrants from Portugal (3.5%, a difference of 0.48%).
| Demographics | Rating | Rank | Professional Degree |
| Cheyenne | 0.5 /100 | #277 | Tragic 3.6% |
| Japanese | 0.5 /100 | #278 | Tragic 3.5% |
| Immigrants | Portugal | 0.5 /100 | #279 | Tragic 3.5% |
| Dominicans | 0.5 /100 | #280 | Tragic 3.5% |
| Apache | 0.5 /100 | #281 | Tragic 3.5% |
| Immigrants | Caribbean | 0.5 /100 | #282 | Tragic 3.5% |
| Comanche | 0.4 /100 | #283 | Tragic 3.5% |
| Salvadorans | 0.4 /100 | #284 | Tragic 3.5% |
| Hondurans | 0.3 /100 | #285 | Tragic 3.5% |
| Haitians | 0.3 /100 | #286 | Tragic 3.5% |
| Immigrants | El Salvador | 0.3 /100 | #287 | Tragic 3.5% |
| Blackfeet | 0.3 /100 | #288 | Tragic 3.5% |
| Guatemalans | 0.3 /100 | #289 | Tragic 3.5% |
| Chippewa | 0.3 /100 | #290 | Tragic 3.5% |
| Alaska Natives | 0.3 /100 | #291 | Tragic 3.5% |
Demographics Similar to Hispanics or Latinos by Professional Degree
In terms of professional degree, the demographic groups most similar to Hispanics or Latinos are Inupiat (3.2%, a difference of 0.080%), Crow (3.2%, a difference of 0.35%), Tsimshian (3.2%, a difference of 0.36%), Yaqui (3.2%, a difference of 0.42%), and Seminole (3.2%, a difference of 0.72%).
| Demographics | Rating | Rank | Professional Degree |
| Immigrants | Laos | 0.1 /100 | #315 | Tragic 3.2% |
| Puerto Ricans | 0.1 /100 | #316 | Tragic 3.2% |
| Nepalese | 0.1 /100 | #317 | Tragic 3.2% |
| Immigrants | Micronesia | 0.1 /100 | #318 | Tragic 3.2% |
| Choctaw | 0.1 /100 | #319 | Tragic 3.2% |
| Seminole | 0.1 /100 | #320 | Tragic 3.2% |
| Tsimshian | 0.0 /100 | #321 | Tragic 3.2% |
| Hispanics or Latinos | 0.0 /100 | #322 | Tragic 3.2% |
| Inupiat | 0.0 /100 | #323 | Tragic 3.2% |
| Crow | 0.0 /100 | #324 | Tragic 3.2% |
| Yaqui | 0.0 /100 | #325 | Tragic 3.2% |
| Menominee | 0.0 /100 | #326 | Tragic 3.1% |
| Dutch West Indians | 0.0 /100 | #327 | Tragic 3.1% |
| Creek | 0.0 /100 | #328 | Tragic 3.1% |
| Bangladeshis | 0.0 /100 | #329 | Tragic 3.1% |