Salvadoran vs Belizean 3rd Grade
COMPARE
Salvadoran
Belizean
3rd Grade
3rd Grade Comparison
Salvadorans
Belizeans
95.7%
3RD GRADE
0.0/ 100
METRIC RATING
344th/ 347
METRIC RANK
96.6%
3RD GRADE
0.0/ 100
METRIC RATING
314th/ 347
METRIC RANK
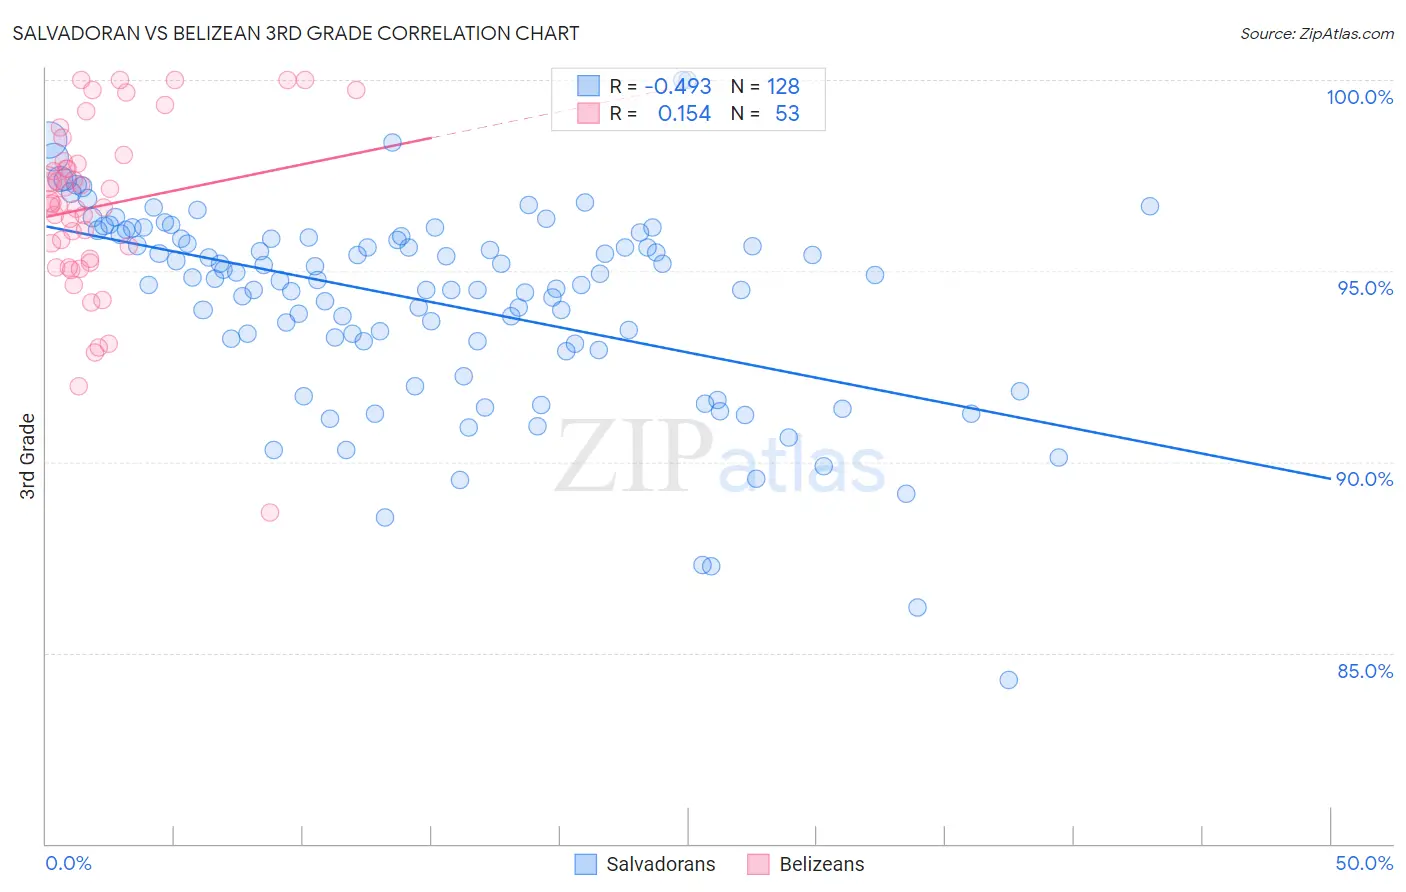
Salvadoran vs Belizean 3rd Grade Correlation Chart
The statistical analysis conducted on geographies consisting of 399,068,107 people shows a moderate negative correlation between the proportion of Salvadorans and percentage of population with at least 3rd grade education in the United States with a correlation coefficient (R) of -0.493 and weighted average of 95.7%. Similarly, the statistical analysis conducted on geographies consisting of 144,224,236 people shows a poor positive correlation between the proportion of Belizeans and percentage of population with at least 3rd grade education in the United States with a correlation coefficient (R) of 0.154 and weighted average of 96.6%, a difference of 0.95%.
3rd Grade Correlation Summary
| Measurement | Salvadoran | Belizean |
| Minimum | 84.3% | 88.7% |
| Maximum | 100.0% | 100.0% |
| Range | 15.7% | 11.3% |
| Mean | 94.2% | 96.7% |
| Median | 94.8% | 96.8% |
| Interquartile 25% (IQ1) | 93.1% | 95.3% |
| Interquartile 75% (IQ3) | 95.9% | 98.0% |
| Interquartile Range (IQR) | 2.8% | 2.7% |
| Standard Deviation (Sample) | 2.6% | 2.3% |
| Standard Deviation (Population) | 2.6% | 2.3% |
Similar Demographics by 3rd Grade
Demographics Similar to Salvadorans by 3rd Grade
In terms of 3rd grade, the demographic groups most similar to Salvadorans are Immigrants from Mexico (95.8%, a difference of 0.11%), Immigrants from Yemen (95.6%, a difference of 0.13%), Immigrants from Central America (95.8%, a difference of 0.14%), Immigrants from Guatemala (95.8%, a difference of 0.14%), and Immigrants from El Salvador (95.5%, a difference of 0.19%).
| Demographics | Rating | Rank | 3rd Grade |
| Immigrants | Fiji | 0.0 /100 | #333 | Tragic 96.2% |
| Immigrants | Cambodia | 0.0 /100 | #334 | Tragic 96.2% |
| Immigrants | Dominican Republic | 0.0 /100 | #335 | Tragic 96.2% |
| Immigrants | Cabo Verde | 0.0 /100 | #336 | Tragic 96.2% |
| Central Americans | 0.0 /100 | #337 | Tragic 96.1% |
| Guatemalans | 0.0 /100 | #338 | Tragic 96.0% |
| Yakama | 0.0 /100 | #339 | Tragic 95.9% |
| Nepalese | 0.0 /100 | #340 | Tragic 95.9% |
| Immigrants | Central America | 0.0 /100 | #341 | Tragic 95.8% |
| Immigrants | Guatemala | 0.0 /100 | #342 | Tragic 95.8% |
| Immigrants | Mexico | 0.0 /100 | #343 | Tragic 95.8% |
| Salvadorans | 0.0 /100 | #344 | Tragic 95.7% |
| Immigrants | Yemen | 0.0 /100 | #345 | Tragic 95.6% |
| Immigrants | El Salvador | 0.0 /100 | #346 | Tragic 95.5% |
| Spanish American Indians | 0.0 /100 | #347 | Tragic 95.3% |
Demographics Similar to Belizeans by 3rd Grade
In terms of 3rd grade, the demographic groups most similar to Belizeans are Immigrants from Ecuador (96.6%, a difference of 0.0%), Immigrants from Laos (96.6%, a difference of 0.010%), Immigrants from the Azores (96.6%, a difference of 0.010%), Immigrants from Burma/Myanmar (96.6%, a difference of 0.020%), and Immigrants from Guyana (96.6%, a difference of 0.030%).
| Demographics | Rating | Rank | 3rd Grade |
| Nicaraguans | 0.0 /100 | #307 | Tragic 96.7% |
| Immigrants | Haiti | 0.0 /100 | #308 | Tragic 96.7% |
| Sri Lankans | 0.0 /100 | #309 | Tragic 96.7% |
| Cape Verdeans | 0.0 /100 | #310 | Tragic 96.6% |
| Immigrants | Guyana | 0.0 /100 | #311 | Tragic 96.6% |
| Immigrants | Laos | 0.0 /100 | #312 | Tragic 96.6% |
| Immigrants | Ecuador | 0.0 /100 | #313 | Tragic 96.6% |
| Belizeans | 0.0 /100 | #314 | Tragic 96.6% |
| Immigrants | Azores | 0.0 /100 | #315 | Tragic 96.6% |
| Immigrants | Burma/Myanmar | 0.0 /100 | #316 | Tragic 96.6% |
| Immigrants | Bangladesh | 0.0 /100 | #317 | Tragic 96.6% |
| Hispanics or Latinos | 0.0 /100 | #318 | Tragic 96.5% |
| Vietnamese | 0.0 /100 | #319 | Tragic 96.5% |
| Immigrants | Nicaragua | 0.0 /100 | #320 | Tragic 96.5% |
| Indonesians | 0.0 /100 | #321 | Tragic 96.5% |