Salvadoran vs Alaska Native No Schooling Completed
COMPARE
Salvadoran
Alaska Native
No Schooling Completed
No Schooling Completed Comparison
Salvadorans
Alaska Natives
3.7%
NO SCHOOLING COMPLETED
0.0/ 100
METRIC RATING
343rd/ 347
METRIC RANK
1.5%
NO SCHOOLING COMPLETED
100.0/ 100
METRIC RATING
22nd/ 347
METRIC RANK
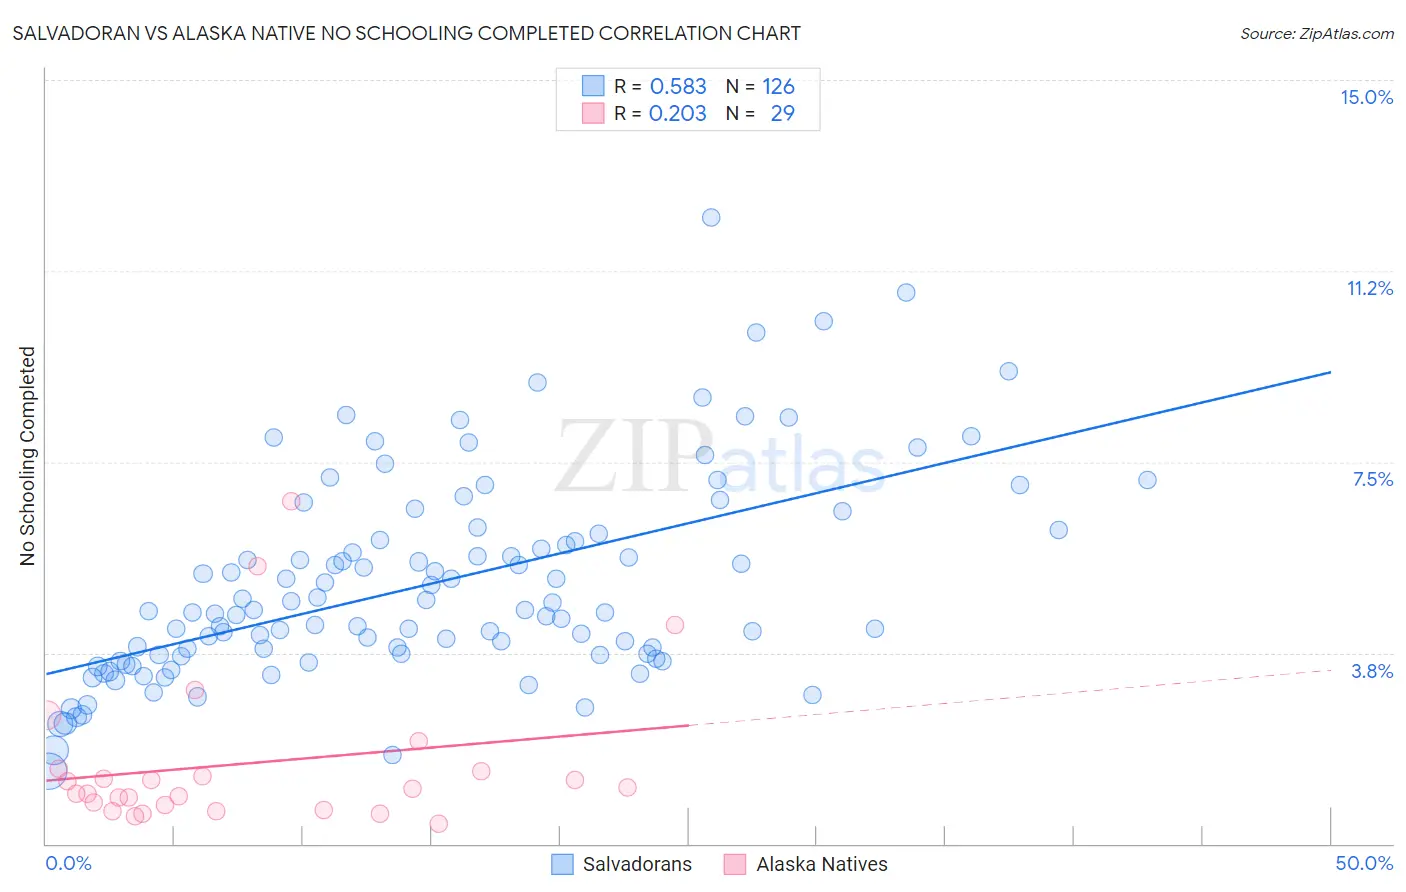
Salvadoran vs Alaska Native No Schooling Completed Correlation Chart
The statistical analysis conducted on geographies consisting of 395,950,136 people shows a substantial positive correlation between the proportion of Salvadorans and percentage of population with no schooling in the United States with a correlation coefficient (R) of 0.583 and weighted average of 3.7%. Similarly, the statistical analysis conducted on geographies consisting of 76,332,603 people shows a weak positive correlation between the proportion of Alaska Natives and percentage of population with no schooling in the United States with a correlation coefficient (R) of 0.203 and weighted average of 1.5%, a difference of 154.0%.
No Schooling Completed Correlation Summary
| Measurement | Salvadoran | Alaska Native |
| Minimum | 1.4% | 0.40% |
| Maximum | 12.3% | 6.7% |
| Range | 10.9% | 6.3% |
| Mean | 5.1% | 1.6% |
| Median | 4.6% | 1.1% |
| Interquartile 25% (IQ1) | 3.7% | 0.71% |
| Interquartile 75% (IQ3) | 6.0% | 1.4% |
| Interquartile Range (IQR) | 2.3% | 0.74% |
| Standard Deviation (Sample) | 2.0% | 1.5% |
| Standard Deviation (Population) | 2.0% | 1.5% |
Similar Demographics by No Schooling Completed
Demographics Similar to Salvadorans by No Schooling Completed
In terms of no schooling completed, the demographic groups most similar to Salvadorans are Nepalese (3.8%, a difference of 1.7%), Immigrants from Mexico (3.6%, a difference of 2.8%), Immigrants from El Salvador (3.9%, a difference of 3.5%), Immigrants from Central America (3.6%, a difference of 3.6%), and Immigrants from Guatemala (3.6%, a difference of 4.7%).
| Demographics | Rating | Rank | No Schooling Completed |
| Immigrants | Dominican Republic | 0.0 /100 | #333 | Tragic 3.4% |
| Guatemalans | 0.0 /100 | #334 | Tragic 3.5% |
| Immigrants | Cambodia | 0.0 /100 | #335 | Tragic 3.5% |
| Immigrants | Fiji | 0.0 /100 | #336 | Tragic 3.5% |
| Immigrants | Cabo Verde | 0.0 /100 | #337 | Tragic 3.5% |
| Bangladeshis | 0.0 /100 | #338 | Tragic 3.5% |
| Yakama | 0.0 /100 | #339 | Tragic 3.6% |
| Immigrants | Guatemala | 0.0 /100 | #340 | Tragic 3.6% |
| Immigrants | Central America | 0.0 /100 | #341 | Tragic 3.6% |
| Immigrants | Mexico | 0.0 /100 | #342 | Tragic 3.6% |
| Salvadorans | 0.0 /100 | #343 | Tragic 3.7% |
| Nepalese | 0.0 /100 | #344 | Tragic 3.8% |
| Immigrants | El Salvador | 0.0 /100 | #345 | Tragic 3.9% |
| Immigrants | Yemen | 0.0 /100 | #346 | Tragic 4.1% |
| Spanish American Indians | 0.0 /100 | #347 | Tragic 4.2% |
Demographics Similar to Alaska Natives by No Schooling Completed
In terms of no schooling completed, the demographic groups most similar to Alaska Natives are Chinese (1.5%, a difference of 0.090%), European (1.5%, a difference of 0.25%), Welsh (1.5%, a difference of 0.46%), Alaskan Athabascan (1.5%, a difference of 0.58%), and Pennsylvania German (1.5%, a difference of 0.61%).
| Demographics | Rating | Rank | No Schooling Completed |
| Tlingit-Haida | 100.0 /100 | #15 | Exceptional 1.5% |
| Finns | 100.0 /100 | #16 | Exceptional 1.5% |
| Croatians | 100.0 /100 | #17 | Exceptional 1.5% |
| Danes | 100.0 /100 | #18 | Exceptional 1.5% |
| Alaskan Athabascans | 100.0 /100 | #19 | Exceptional 1.5% |
| Welsh | 100.0 /100 | #20 | Exceptional 1.5% |
| Chinese | 100.0 /100 | #21 | Exceptional 1.5% |
| Alaska Natives | 100.0 /100 | #22 | Exceptional 1.5% |
| Europeans | 100.0 /100 | #23 | Exceptional 1.5% |
| Pennsylvania Germans | 100.0 /100 | #24 | Exceptional 1.5% |
| French | 100.0 /100 | #25 | Exceptional 1.5% |
| Czechs | 100.0 /100 | #26 | Exceptional 1.5% |
| Scandinavians | 100.0 /100 | #27 | Exceptional 1.5% |
| French Canadians | 100.0 /100 | #28 | Exceptional 1.5% |
| Lumbee | 100.0 /100 | #29 | Exceptional 1.5% |