Russian vs Yaqui High School Diploma
COMPARE
Russian
Yaqui
High School Diploma
High School Diploma Comparison
Russians
Yaqui
91.5%
HIGH SCHOOL DIPLOMA
99.9/ 100
METRIC RATING
26th/ 347
METRIC RANK
84.7%
HIGH SCHOOL DIPLOMA
0.0/ 100
METRIC RATING
314th/ 347
METRIC RANK
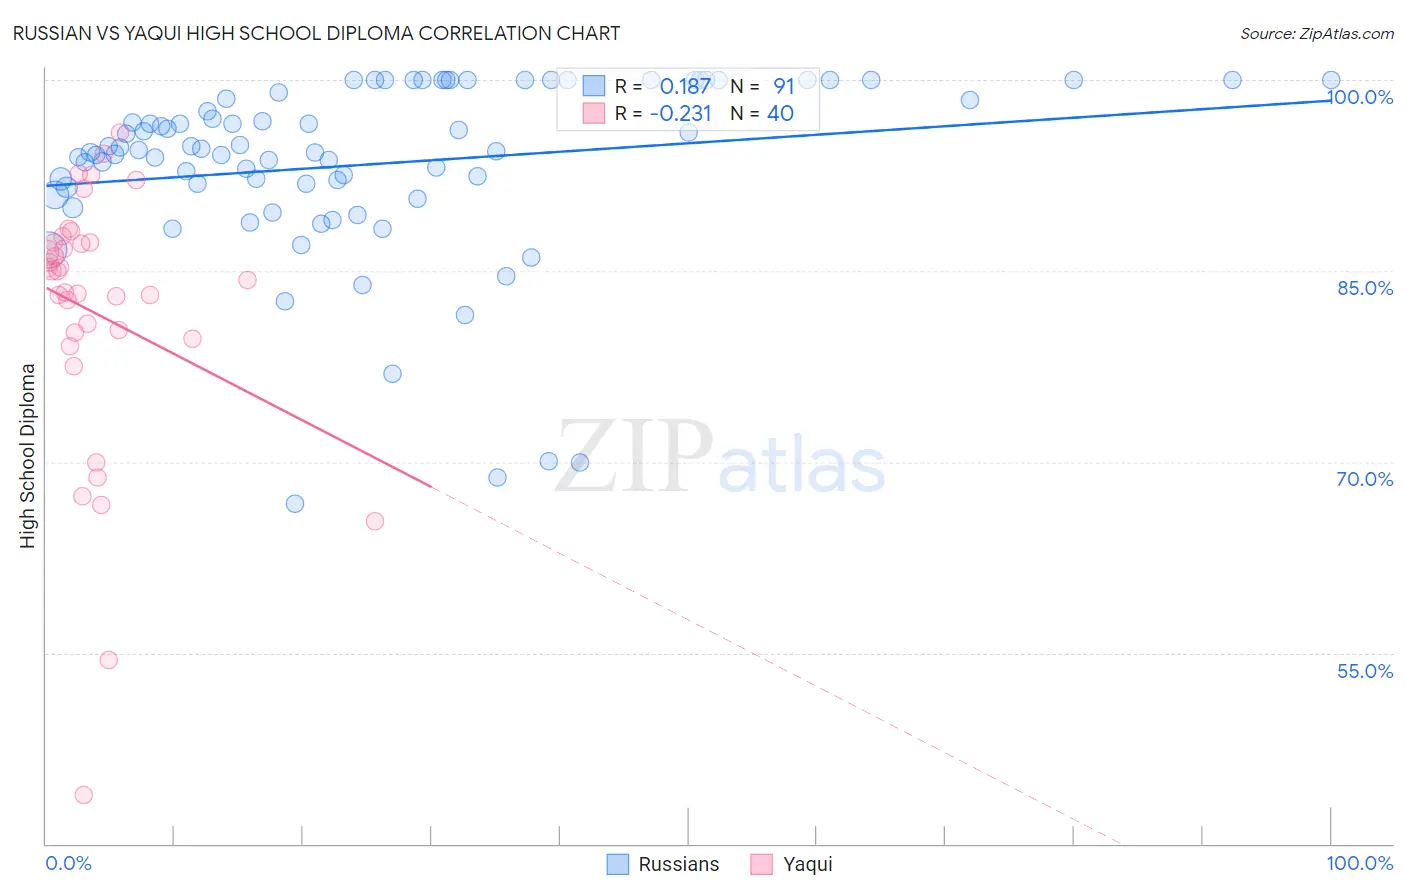
Russian vs Yaqui High School Diploma Correlation Chart
The statistical analysis conducted on geographies consisting of 512,259,122 people shows a poor positive correlation between the proportion of Russians and percentage of population with at least high school diploma education in the United States with a correlation coefficient (R) of 0.187 and weighted average of 91.5%. Similarly, the statistical analysis conducted on geographies consisting of 107,732,380 people shows a weak negative correlation between the proportion of Yaqui and percentage of population with at least high school diploma education in the United States with a correlation coefficient (R) of -0.231 and weighted average of 84.7%, a difference of 8.0%.
High School Diploma Correlation Summary
| Measurement | Russian | Yaqui |
| Minimum | 66.7% | 43.8% |
| Maximum | 100.0% | 95.8% |
| Range | 33.3% | 52.1% |
| Mean | 93.4% | 81.7% |
| Median | 94.5% | 84.6% |
| Interquartile 25% (IQ1) | 91.6% | 79.9% |
| Interquartile 75% (IQ3) | 100.0% | 87.3% |
| Interquartile Range (IQR) | 8.4% | 7.3% |
| Standard Deviation (Sample) | 7.2% | 10.6% |
| Standard Deviation (Population) | 7.2% | 10.5% |
Similar Demographics by High School Diploma
Demographics Similar to Russians by High School Diploma
In terms of high school diploma, the demographic groups most similar to Russians are Cypriot (91.5%, a difference of 0.010%), Italian (91.5%, a difference of 0.050%), Thai (91.5%, a difference of 0.050%), Tlingit-Haida (91.4%, a difference of 0.050%), and Scandinavian (91.5%, a difference of 0.060%).
| Demographics | Rating | Rank | High School Diploma |
| Maltese | 99.9 /100 | #19 | Exceptional 91.6% |
| Czechs | 99.9 /100 | #20 | Exceptional 91.6% |
| Filipinos | 99.9 /100 | #21 | Exceptional 91.6% |
| Estonians | 99.9 /100 | #22 | Exceptional 91.6% |
| Scandinavians | 99.9 /100 | #23 | Exceptional 91.5% |
| Italians | 99.9 /100 | #24 | Exceptional 91.5% |
| Thais | 99.9 /100 | #25 | Exceptional 91.5% |
| Russians | 99.9 /100 | #26 | Exceptional 91.5% |
| Cypriots | 99.9 /100 | #27 | Exceptional 91.5% |
| Tlingit-Haida | 99.9 /100 | #28 | Exceptional 91.4% |
| Europeans | 99.9 /100 | #29 | Exceptional 91.4% |
| Iranians | 99.9 /100 | #30 | Exceptional 91.4% |
| Immigrants | Northern Europe | 99.9 /100 | #31 | Exceptional 91.4% |
| English | 99.9 /100 | #32 | Exceptional 91.4% |
| Okinawans | 99.9 /100 | #33 | Exceptional 91.4% |
Demographics Similar to Yaqui by High School Diploma
In terms of high school diploma, the demographic groups most similar to Yaqui are Puerto Rican (84.7%, a difference of 0.10%), Immigrants from Ecuador (84.8%, a difference of 0.11%), Cape Verdean (85.1%, a difference of 0.37%), Ecuadorian (85.1%, a difference of 0.42%), and Apache (85.1%, a difference of 0.43%).
| Demographics | Rating | Rank | High School Diploma |
| Navajo | 0.0 /100 | #307 | Tragic 85.2% |
| Immigrants | Armenia | 0.0 /100 | #308 | Tragic 85.2% |
| Immigrants | Dominica | 0.0 /100 | #309 | Tragic 85.2% |
| Apache | 0.0 /100 | #310 | Tragic 85.1% |
| Ecuadorians | 0.0 /100 | #311 | Tragic 85.1% |
| Cape Verdeans | 0.0 /100 | #312 | Tragic 85.1% |
| Immigrants | Ecuador | 0.0 /100 | #313 | Tragic 84.8% |
| Yaqui | 0.0 /100 | #314 | Tragic 84.7% |
| Puerto Ricans | 0.0 /100 | #315 | Tragic 84.7% |
| Belizeans | 0.0 /100 | #316 | Tragic 84.3% |
| Immigrants | Caribbean | 0.0 /100 | #317 | Tragic 84.3% |
| Immigrants | Belize | 0.0 /100 | #318 | Tragic 84.2% |
| Central American Indians | 0.0 /100 | #319 | Tragic 84.2% |
| Nicaraguans | 0.0 /100 | #320 | Tragic 84.1% |
| Yuman | 0.0 /100 | #321 | Tragic 84.0% |