Russian vs Mexican 10th Grade
COMPARE
Russian
Mexican
10th Grade
10th Grade Comparison
Russians
Mexicans
95.2%
10TH GRADE
99.9/ 100
METRIC RATING
41st/ 347
METRIC RANK
87.8%
10TH GRADE
0.0/ 100
METRIC RATING
340th/ 347
METRIC RANK
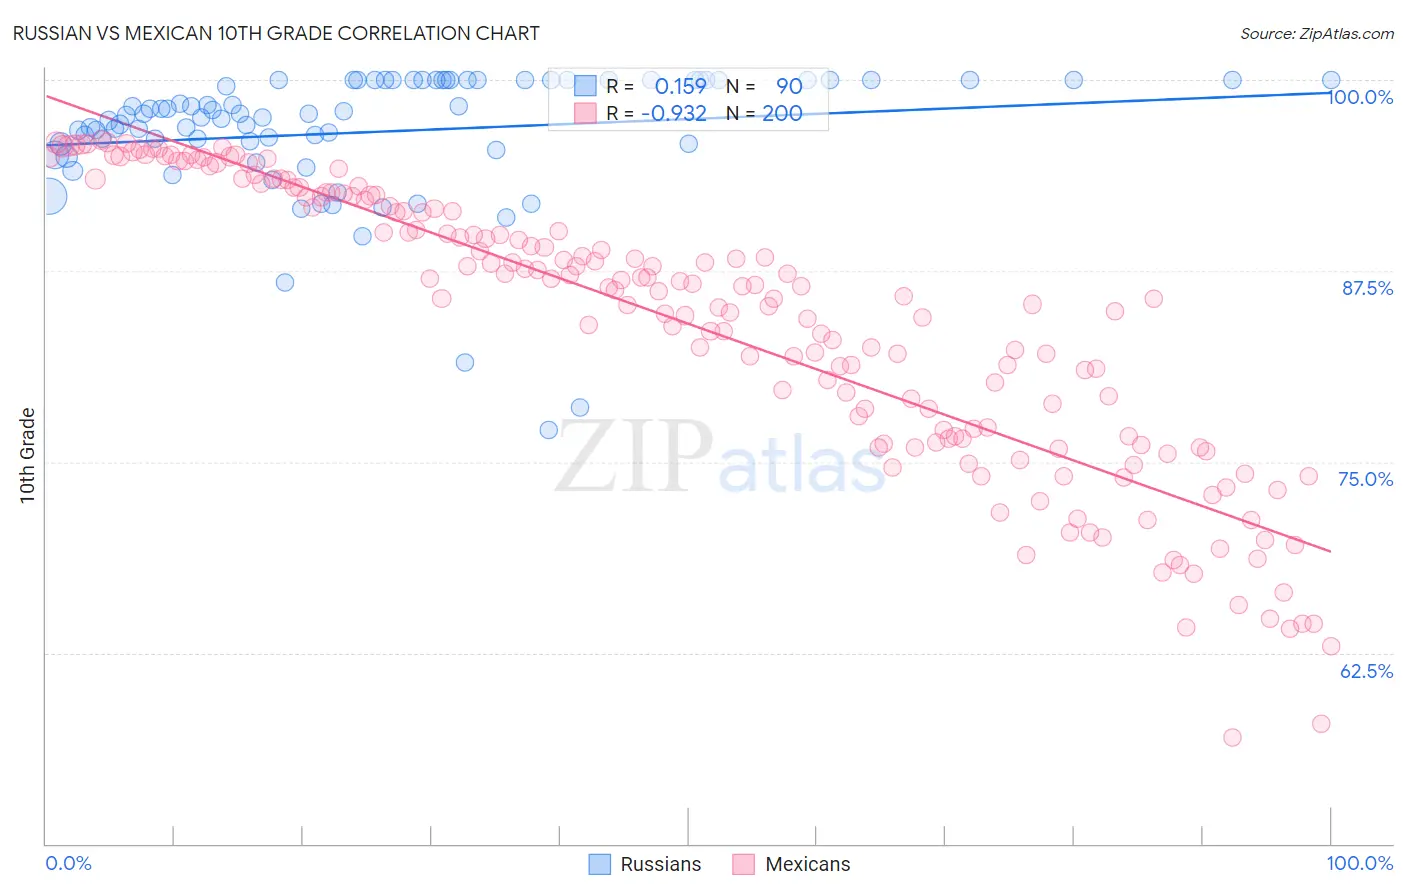
Russian vs Mexican 10th Grade Correlation Chart
The statistical analysis conducted on geographies consisting of 512,259,033 people shows a poor positive correlation between the proportion of Russians and percentage of population with at least 10th grade education in the United States with a correlation coefficient (R) of 0.159 and weighted average of 95.2%. Similarly, the statistical analysis conducted on geographies consisting of 565,338,990 people shows a near-perfect negative correlation between the proportion of Mexicans and percentage of population with at least 10th grade education in the United States with a correlation coefficient (R) of -0.932 and weighted average of 87.8%, a difference of 8.5%.
10th Grade Correlation Summary
| Measurement | Russian | Mexican |
| Minimum | 77.1% | 57.0% |
| Maximum | 100.0% | 96.1% |
| Range | 22.9% | 39.1% |
| Mean | 96.6% | 84.0% |
| Median | 97.7% | 86.3% |
| Interquartile 25% (IQ1) | 95.8% | 76.6% |
| Interquartile 75% (IQ3) | 100.0% | 92.3% |
| Interquartile Range (IQR) | 4.2% | 15.7% |
| Standard Deviation (Sample) | 4.4% | 9.3% |
| Standard Deviation (Population) | 4.4% | 9.2% |
Similar Demographics by 10th Grade
Demographics Similar to Russians by 10th Grade
In terms of 10th grade, the demographic groups most similar to Russians are Scotch-Irish (95.2%, a difference of 0.020%), Immigrants from Scotland (95.2%, a difference of 0.030%), Slavic (95.2%, a difference of 0.030%), Northern European (95.3%, a difference of 0.050%), and Macedonian (95.2%, a difference of 0.050%).
| Demographics | Rating | Rank | 10th Grade |
| British | 99.9 /100 | #34 | Exceptional 95.3% |
| Estonians | 99.9 /100 | #35 | Exceptional 95.3% |
| Immigrants | India | 99.9 /100 | #36 | Exceptional 95.3% |
| French Canadians | 99.9 /100 | #37 | Exceptional 95.3% |
| Northern Europeans | 99.9 /100 | #38 | Exceptional 95.3% |
| Immigrants | Scotland | 99.9 /100 | #39 | Exceptional 95.2% |
| Scotch-Irish | 99.9 /100 | #40 | Exceptional 95.2% |
| Russians | 99.9 /100 | #41 | Exceptional 95.2% |
| Slavs | 99.9 /100 | #42 | Exceptional 95.2% |
| Macedonians | 99.9 /100 | #43 | Exceptional 95.2% |
| Immigrants | Northern Europe | 99.9 /100 | #44 | Exceptional 95.2% |
| Greeks | 99.9 /100 | #45 | Exceptional 95.2% |
| Czechoslovakians | 99.9 /100 | #46 | Exceptional 95.1% |
| Serbians | 99.9 /100 | #47 | Exceptional 95.1% |
| Australians | 99.9 /100 | #48 | Exceptional 95.1% |
Demographics Similar to Mexicans by 10th Grade
In terms of 10th grade, the demographic groups most similar to Mexicans are Guatemalan (87.9%, a difference of 0.16%), Salvadoran (87.5%, a difference of 0.29%), Immigrants from Guatemala (87.4%, a difference of 0.44%), Immigrants from Latin America (88.3%, a difference of 0.65%), and Central American (88.4%, a difference of 0.71%).
| Demographics | Rating | Rank | 10th Grade |
| Hondurans | 0.0 /100 | #333 | Tragic 89.0% |
| Hispanics or Latinos | 0.0 /100 | #334 | Tragic 88.9% |
| Immigrants | Dominican Republic | 0.0 /100 | #335 | Tragic 88.7% |
| Immigrants | Honduras | 0.0 /100 | #336 | Tragic 88.5% |
| Central Americans | 0.0 /100 | #337 | Tragic 88.4% |
| Immigrants | Latin America | 0.0 /100 | #338 | Tragic 88.3% |
| Guatemalans | 0.0 /100 | #339 | Tragic 87.9% |
| Mexicans | 0.0 /100 | #340 | Tragic 87.8% |
| Salvadorans | 0.0 /100 | #341 | Tragic 87.5% |
| Immigrants | Guatemala | 0.0 /100 | #342 | Tragic 87.4% |
| Yakama | 0.0 /100 | #343 | Tragic 86.9% |
| Immigrants | El Salvador | 0.0 /100 | #344 | Tragic 86.8% |
| Immigrants | Central America | 0.0 /100 | #345 | Tragic 86.6% |
| Spanish American Indians | 0.0 /100 | #346 | Tragic 86.2% |
| Immigrants | Mexico | 0.0 /100 | #347 | Tragic 86.2% |