Russian vs Immigrants from Trinidad and Tobago Associate's Degree
COMPARE
Russian
Immigrants from Trinidad and Tobago
Associate's Degree
Associate's Degree Comparison
Russians
Immigrants from Trinidad and Tobago
53.2%
ASSOCIATE'S DEGREE
100.0/ 100
METRIC RATING
35th/ 347
METRIC RANK
43.3%
ASSOCIATE'S DEGREE
3.0/ 100
METRIC RATING
229th/ 347
METRIC RANK
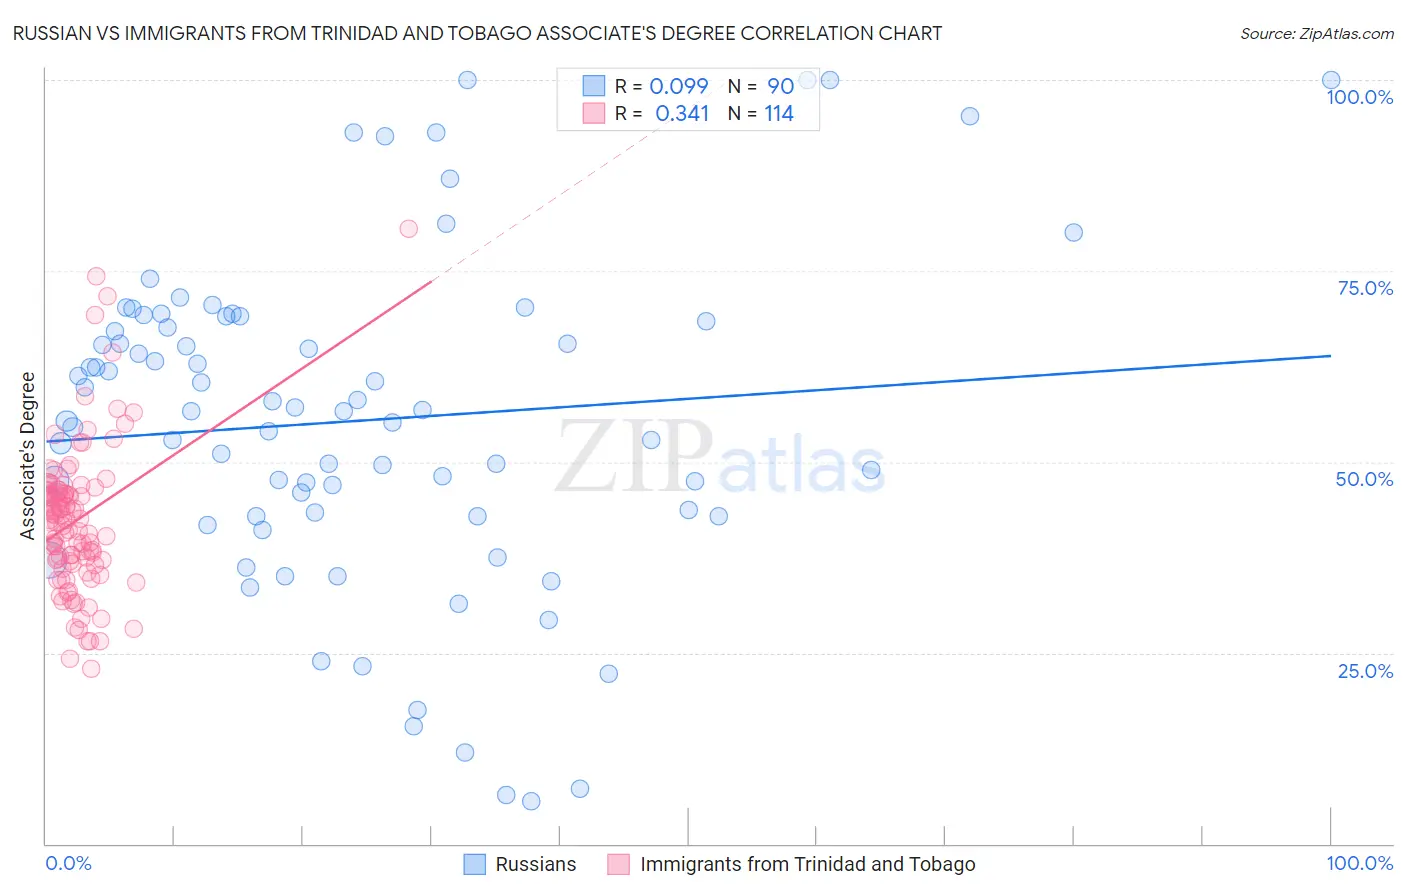
Russian vs Immigrants from Trinidad and Tobago Associate's Degree Correlation Chart
The statistical analysis conducted on geographies consisting of 512,209,602 people shows a slight positive correlation between the proportion of Russians and percentage of population with at least associate's degree education in the United States with a correlation coefficient (R) of 0.099 and weighted average of 53.2%. Similarly, the statistical analysis conducted on geographies consisting of 223,520,472 people shows a mild positive correlation between the proportion of Immigrants from Trinidad and Tobago and percentage of population with at least associate's degree education in the United States with a correlation coefficient (R) of 0.341 and weighted average of 43.3%, a difference of 22.9%.
Associate's Degree Correlation Summary
| Measurement | Russian | Immigrants from Trinidad and Tobago |
| Minimum | 5.6% | 23.0% |
| Maximum | 100.0% | 80.5% |
| Range | 94.4% | 57.6% |
| Mean | 55.4% | 42.4% |
| Median | 56.6% | 42.4% |
| Interquartile 25% (IQ1) | 42.9% | 37.0% |
| Interquartile 75% (IQ3) | 68.4% | 46.1% |
| Interquartile Range (IQR) | 25.5% | 9.1% |
| Standard Deviation (Sample) | 21.5% | 9.7% |
| Standard Deviation (Population) | 21.3% | 9.7% |
Similar Demographics by Associate's Degree
Demographics Similar to Russians by Associate's Degree
In terms of associate's degree, the demographic groups most similar to Russians are Bulgarian (53.3%, a difference of 0.060%), Israeli (53.4%, a difference of 0.26%), Immigrants from Russia (53.1%, a difference of 0.28%), Immigrants from Denmark (53.1%, a difference of 0.36%), and Immigrants from Turkey (53.4%, a difference of 0.38%).
| Demographics | Rating | Rank | Associate's Degree |
| Turks | 100.0 /100 | #28 | Exceptional 53.9% |
| Immigrants | France | 100.0 /100 | #29 | Exceptional 53.9% |
| Immigrants | Sri Lanka | 100.0 /100 | #30 | Exceptional 53.7% |
| Immigrants | Northern Europe | 100.0 /100 | #31 | Exceptional 53.5% |
| Immigrants | Turkey | 100.0 /100 | #32 | Exceptional 53.4% |
| Israelis | 100.0 /100 | #33 | Exceptional 53.4% |
| Bulgarians | 100.0 /100 | #34 | Exceptional 53.3% |
| Russians | 100.0 /100 | #35 | Exceptional 53.2% |
| Immigrants | Russia | 100.0 /100 | #36 | Exceptional 53.1% |
| Immigrants | Denmark | 100.0 /100 | #37 | Exceptional 53.1% |
| Mongolians | 100.0 /100 | #38 | Exceptional 53.0% |
| Immigrants | Belarus | 99.9 /100 | #39 | Exceptional 52.8% |
| Immigrants | Latvia | 99.9 /100 | #40 | Exceptional 52.8% |
| Immigrants | Saudi Arabia | 99.9 /100 | #41 | Exceptional 52.6% |
| Immigrants | Malaysia | 99.9 /100 | #42 | Exceptional 52.5% |
Demographics Similar to Immigrants from Trinidad and Tobago by Associate's Degree
In terms of associate's degree, the demographic groups most similar to Immigrants from Trinidad and Tobago are Immigrants from Barbados (43.3%, a difference of 0.070%), Liberian (43.3%, a difference of 0.080%), Hmong (43.4%, a difference of 0.16%), Native Hawaiian (43.1%, a difference of 0.50%), and Trinidadian and Tobagonian (43.6%, a difference of 0.60%).
| Demographics | Rating | Rank | Associate's Degree |
| Barbadians | 5.8 /100 | #222 | Tragic 43.9% |
| Sub-Saharan Africans | 5.5 /100 | #223 | Tragic 43.9% |
| West Indians | 5.2 /100 | #224 | Tragic 43.8% |
| Guamanians/Chamorros | 4.8 /100 | #225 | Tragic 43.8% |
| Immigrants | Burma/Myanmar | 4.3 /100 | #226 | Tragic 43.7% |
| Trinidadians and Tobagonians | 4.0 /100 | #227 | Tragic 43.6% |
| Hmong | 3.2 /100 | #228 | Tragic 43.4% |
| Immigrants | Trinidad and Tobago | 3.0 /100 | #229 | Tragic 43.3% |
| Immigrants | Barbados | 2.9 /100 | #230 | Tragic 43.3% |
| Liberians | 2.9 /100 | #231 | Tragic 43.3% |
| Native Hawaiians | 2.3 /100 | #232 | Tragic 43.1% |
| Tongans | 2.2 /100 | #233 | Tragic 43.0% |
| Tlingit-Haida | 2.1 /100 | #234 | Tragic 43.0% |
| Ecuadorians | 2.0 /100 | #235 | Tragic 43.0% |
| Immigrants | St. Vincent and the Grenadines | 1.9 /100 | #236 | Tragic 42.9% |