Russian vs Ecuadorian 1st Grade
COMPARE
Russian
Ecuadorian
1st Grade
1st Grade Comparison
Russians
Ecuadorians
98.3%
1ST GRADE
99.6/ 100
METRIC RATING
70th/ 347
METRIC RANK
97.0%
1ST GRADE
0.0/ 100
METRIC RATING
305th/ 347
METRIC RANK
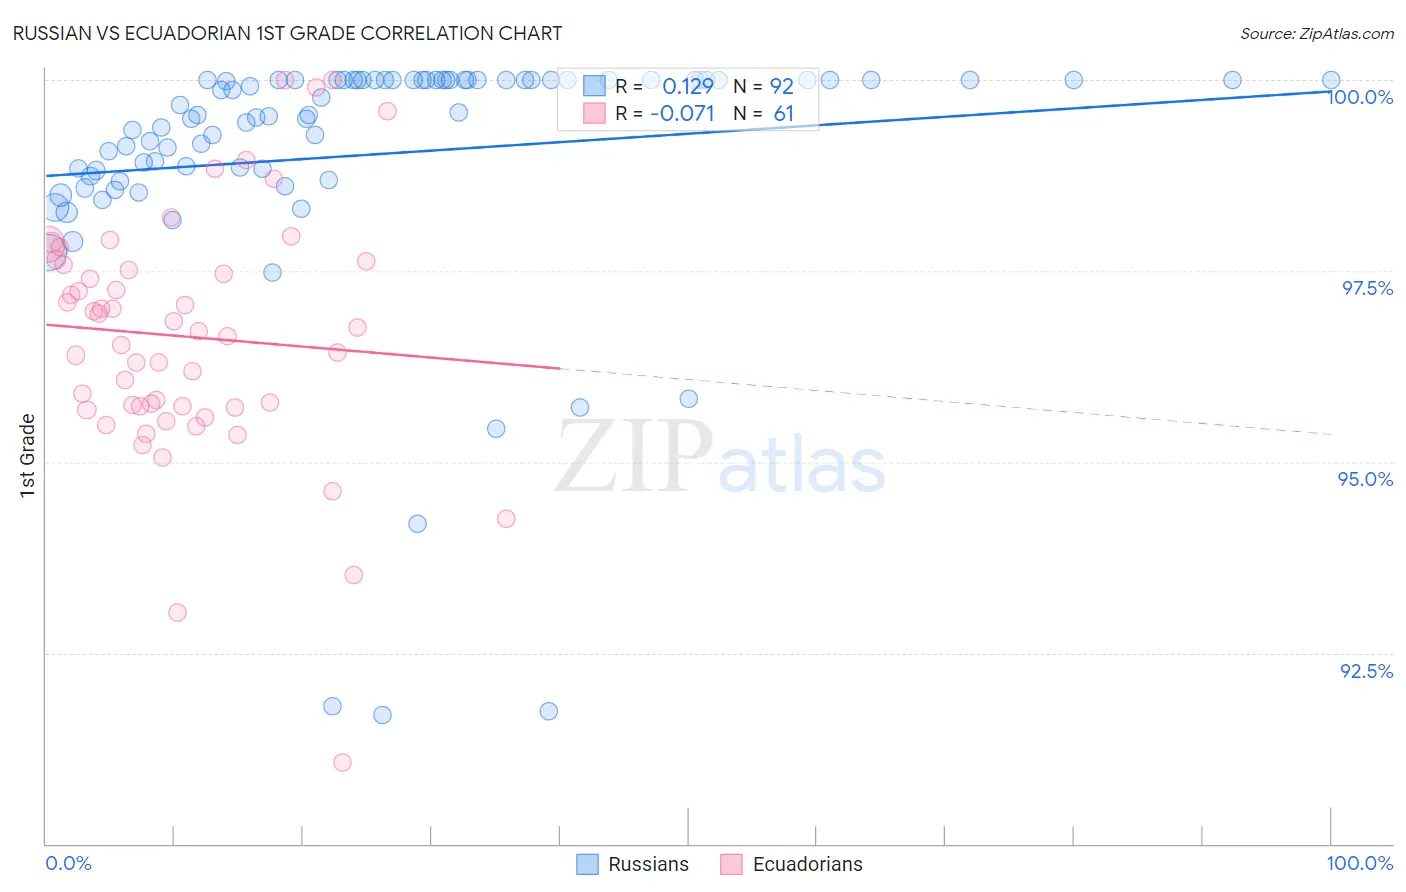
Russian vs Ecuadorian 1st Grade Correlation Chart
The statistical analysis conducted on geographies consisting of 512,259,139 people shows a poor positive correlation between the proportion of Russians and percentage of population with at least 1st grade education in the United States with a correlation coefficient (R) of 0.129 and weighted average of 98.3%. Similarly, the statistical analysis conducted on geographies consisting of 317,865,723 people shows a slight negative correlation between the proportion of Ecuadorians and percentage of population with at least 1st grade education in the United States with a correlation coefficient (R) of -0.071 and weighted average of 97.0%, a difference of 1.4%.
1st Grade Correlation Summary
| Measurement | Russian | Ecuadorian |
| Minimum | 91.7% | 91.1% |
| Maximum | 100.0% | 100.0% |
| Range | 8.3% | 8.9% |
| Mean | 99.0% | 96.6% |
| Median | 99.6% | 96.7% |
| Interquartile 25% (IQ1) | 98.8% | 95.7% |
| Interquartile 75% (IQ3) | 100.0% | 97.6% |
| Interquartile Range (IQR) | 1.2% | 1.9% |
| Standard Deviation (Sample) | 1.7% | 1.6% |
| Standard Deviation (Population) | 1.7% | 1.6% |
Similar Demographics by 1st Grade
Demographics Similar to Russians by 1st Grade
In terms of 1st grade, the demographic groups most similar to Russians are Immigrants from Austria (98.3%, a difference of 0.0%), Immigrants from Northern Europe (98.3%, a difference of 0.0%), Chickasaw (98.3%, a difference of 0.0%), Serbian (98.3%, a difference of 0.0%), and Canadian (98.3%, a difference of 0.010%).
| Demographics | Rating | Rank | 1st Grade |
| Immigrants | North America | 99.7 /100 | #63 | Exceptional 98.4% |
| Greeks | 99.7 /100 | #64 | Exceptional 98.4% |
| Maltese | 99.7 /100 | #65 | Exceptional 98.4% |
| Canadians | 99.6 /100 | #66 | Exceptional 98.3% |
| Immigrants | Austria | 99.6 /100 | #67 | Exceptional 98.3% |
| Immigrants | Northern Europe | 99.6 /100 | #68 | Exceptional 98.3% |
| Chickasaw | 99.6 /100 | #69 | Exceptional 98.3% |
| Russians | 99.6 /100 | #70 | Exceptional 98.3% |
| Serbians | 99.6 /100 | #71 | Exceptional 98.3% |
| Cheyenne | 99.6 /100 | #72 | Exceptional 98.3% |
| Cajuns | 99.5 /100 | #73 | Exceptional 98.3% |
| Immigrants | Netherlands | 99.4 /100 | #74 | Exceptional 98.3% |
| Cherokee | 99.3 /100 | #75 | Exceptional 98.3% |
| Shoshone | 99.3 /100 | #76 | Exceptional 98.3% |
| Immigrants | England | 99.3 /100 | #77 | Exceptional 98.3% |
Demographics Similar to Ecuadorians by 1st Grade
In terms of 1st grade, the demographic groups most similar to Ecuadorians are Nicaraguan (97.0%, a difference of 0.0%), Somali (97.0%, a difference of 0.020%), Immigrants from Caribbean (97.0%, a difference of 0.050%), Belizean (96.9%, a difference of 0.060%), and Immigrants from Somalia (96.9%, a difference of 0.060%).
| Demographics | Rating | Rank | 1st Grade |
| Immigrants | Dominica | 0.0 /100 | #298 | Tragic 97.1% |
| Immigrants | Cuba | 0.0 /100 | #299 | Tragic 97.1% |
| Haitians | 0.0 /100 | #300 | Tragic 97.1% |
| Immigrants | South Eastern Asia | 0.0 /100 | #301 | Tragic 97.1% |
| Immigrants | Caribbean | 0.0 /100 | #302 | Tragic 97.0% |
| Somalis | 0.0 /100 | #303 | Tragic 97.0% |
| Nicaraguans | 0.0 /100 | #304 | Tragic 97.0% |
| Ecuadorians | 0.0 /100 | #305 | Tragic 97.0% |
| Belizeans | 0.0 /100 | #306 | Tragic 96.9% |
| Immigrants | Somalia | 0.0 /100 | #307 | Tragic 96.9% |
| Hispanics or Latinos | 0.0 /100 | #308 | Tragic 96.9% |
| Immigrants | Haiti | 0.0 /100 | #309 | Tragic 96.9% |
| Immigrants | Azores | 0.0 /100 | #310 | Tragic 96.9% |
| Sri Lankans | 0.0 /100 | #311 | Tragic 96.9% |
| Cape Verdeans | 0.0 /100 | #312 | Tragic 96.9% |