Romanian vs Italian Professional Degree
COMPARE
Romanian
Italian
Professional Degree
Professional Degree Comparison
Romanians
Italians
5.3%
PROFESSIONAL DEGREE
99.6/ 100
METRIC RATING
82nd/ 347
METRIC RANK
4.8%
PROFESSIONAL DEGREE
90.2/ 100
METRIC RATING
133rd/ 347
METRIC RANK
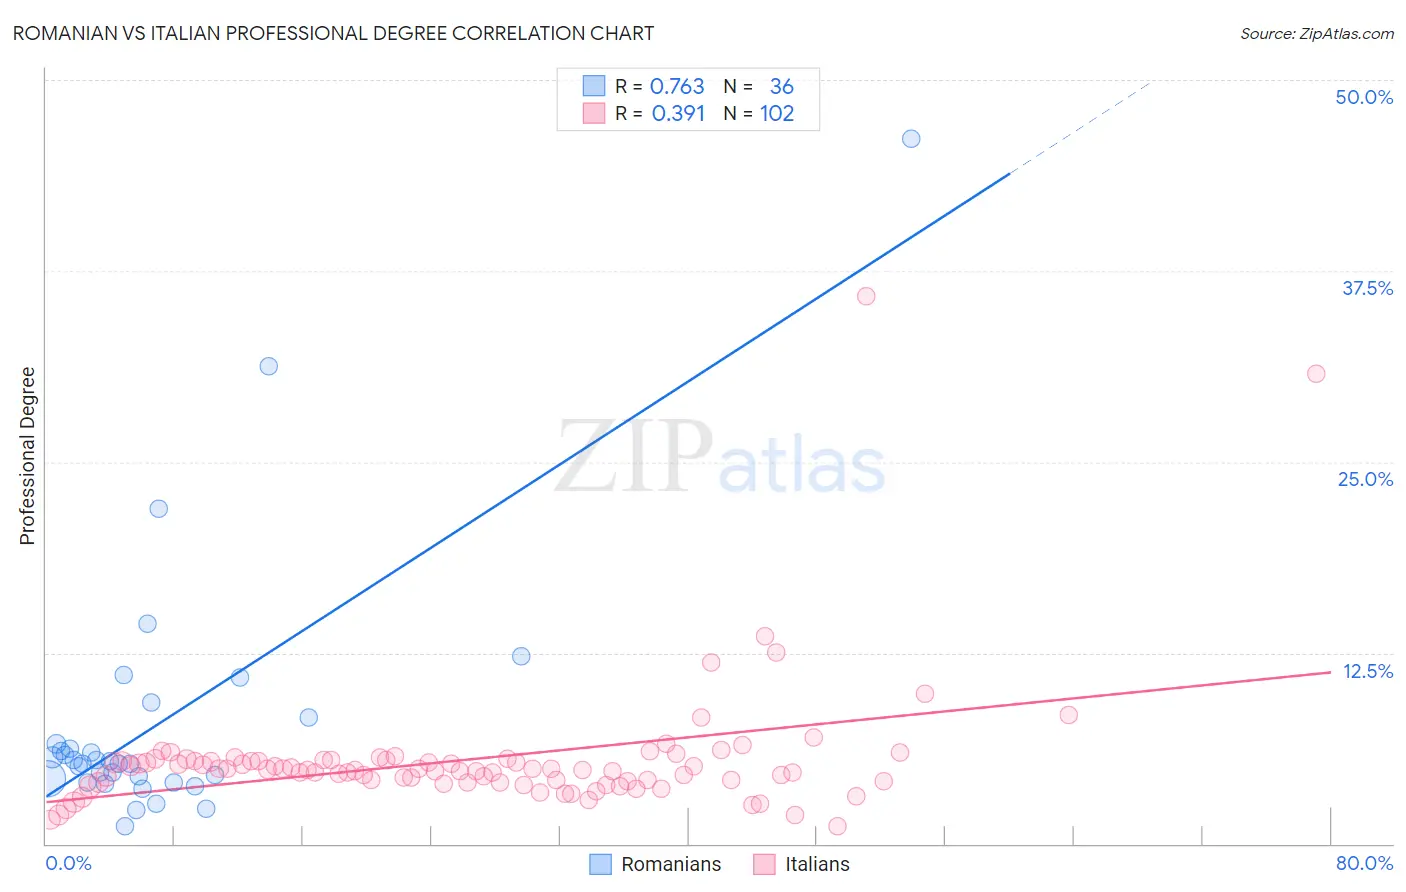
Romanian vs Italian Professional Degree Correlation Chart
The statistical analysis conducted on geographies consisting of 377,177,462 people shows a strong positive correlation between the proportion of Romanians and percentage of population with at least professional degree education in the United States with a correlation coefficient (R) of 0.763 and weighted average of 5.3%. Similarly, the statistical analysis conducted on geographies consisting of 566,305,731 people shows a mild positive correlation between the proportion of Italians and percentage of population with at least professional degree education in the United States with a correlation coefficient (R) of 0.391 and weighted average of 4.8%, a difference of 10.9%.
Professional Degree Correlation Summary
| Measurement | Romanian | Italian |
| Minimum | 1.1% | 1.1% |
| Maximum | 46.2% | 35.9% |
| Range | 45.0% | 34.7% |
| Mean | 8.0% | 5.5% |
| Median | 5.3% | 4.9% |
| Interquartile 25% (IQ1) | 4.2% | 4.1% |
| Interquartile 75% (IQ3) | 7.4% | 5.5% |
| Interquartile Range (IQR) | 3.2% | 1.4% |
| Standard Deviation (Sample) | 8.7% | 4.4% |
| Standard Deviation (Population) | 8.5% | 4.4% |
Similar Demographics by Professional Degree
Demographics Similar to Romanians by Professional Degree
In terms of professional degree, the demographic groups most similar to Romanians are Carpatho Rusyn (5.3%, a difference of 0.20%), Immigrants from Croatia (5.3%, a difference of 0.20%), Immigrants from Zimbabwe (5.3%, a difference of 0.22%), Greek (5.3%, a difference of 0.23%), and Immigrants from Chile (5.3%, a difference of 0.33%).
| Demographics | Rating | Rank | Professional Degree |
| Immigrants | Indonesia | 99.7 /100 | #75 | Exceptional 5.3% |
| Immigrants | Canada | 99.7 /100 | #76 | Exceptional 5.3% |
| Immigrants | Ethiopia | 99.7 /100 | #77 | Exceptional 5.3% |
| Armenians | 99.7 /100 | #78 | Exceptional 5.3% |
| Immigrants | North America | 99.7 /100 | #79 | Exceptional 5.3% |
| Immigrants | England | 99.6 /100 | #80 | Exceptional 5.3% |
| Immigrants | Brazil | 99.6 /100 | #81 | Exceptional 5.3% |
| Romanians | 99.6 /100 | #82 | Exceptional 5.3% |
| Carpatho Rusyns | 99.6 /100 | #83 | Exceptional 5.3% |
| Immigrants | Croatia | 99.6 /100 | #84 | Exceptional 5.3% |
| Immigrants | Zimbabwe | 99.6 /100 | #85 | Exceptional 5.3% |
| Greeks | 99.6 /100 | #86 | Exceptional 5.3% |
| Immigrants | Chile | 99.5 /100 | #87 | Exceptional 5.3% |
| Egyptians | 99.5 /100 | #88 | Exceptional 5.3% |
| Chileans | 99.5 /100 | #89 | Exceptional 5.3% |
Demographics Similar to Italians by Professional Degree
In terms of professional degree, the demographic groups most similar to Italians are South American Indian (4.8%, a difference of 0.12%), Macedonian (4.8%, a difference of 0.16%), Pakistani (4.8%, a difference of 0.25%), Immigrants from Jordan (4.7%, a difference of 0.44%), and Jordanian (4.7%, a difference of 0.46%).
| Demographics | Rating | Rank | Professional Degree |
| Europeans | 93.2 /100 | #126 | Exceptional 4.8% |
| Serbians | 92.6 /100 | #127 | Exceptional 4.8% |
| Immigrants | Eastern Africa | 92.5 /100 | #128 | Exceptional 4.8% |
| Palestinians | 91.5 /100 | #129 | Exceptional 4.8% |
| Icelanders | 91.5 /100 | #130 | Exceptional 4.8% |
| Immigrants | Nepal | 91.4 /100 | #131 | Exceptional 4.8% |
| Pakistanis | 90.9 /100 | #132 | Exceptional 4.8% |
| Italians | 90.2 /100 | #133 | Exceptional 4.8% |
| South American Indians | 89.9 /100 | #134 | Excellent 4.8% |
| Macedonians | 89.8 /100 | #135 | Excellent 4.8% |
| Immigrants | Jordan | 89.0 /100 | #136 | Excellent 4.7% |
| Jordanians | 88.9 /100 | #137 | Excellent 4.7% |
| Afghans | 88.8 /100 | #138 | Excellent 4.7% |
| South Americans | 85.6 /100 | #139 | Excellent 4.7% |
| Canadians | 84.4 /100 | #140 | Excellent 4.7% |