Romanian vs Immigrants from Cameroon 10th Grade
COMPARE
Romanian
Immigrants from Cameroon
10th Grade
10th Grade Comparison
Romanians
Immigrants from Cameroon
94.8%
10TH GRADE
99.5/ 100
METRIC RATING
76th/ 347
METRIC RANK
93.0%
10TH GRADE
2.6/ 100
METRIC RATING
242nd/ 347
METRIC RANK
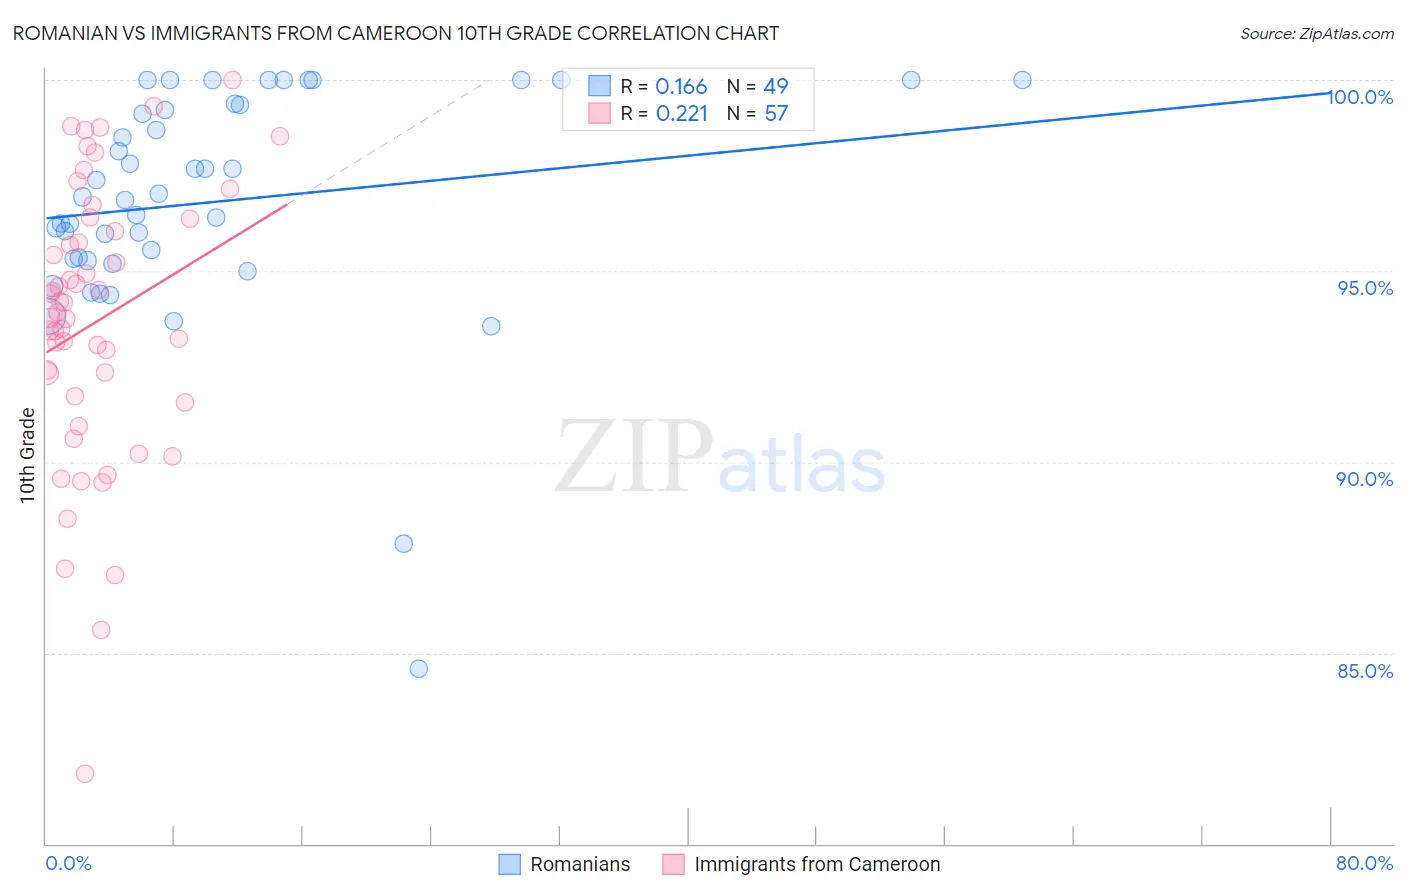
Romanian vs Immigrants from Cameroon 10th Grade Correlation Chart
The statistical analysis conducted on geographies consisting of 377,905,060 people shows a poor positive correlation between the proportion of Romanians and percentage of population with at least 10th grade education in the United States with a correlation coefficient (R) of 0.166 and weighted average of 94.8%. Similarly, the statistical analysis conducted on geographies consisting of 130,618,704 people shows a weak positive correlation between the proportion of Immigrants from Cameroon and percentage of population with at least 10th grade education in the United States with a correlation coefficient (R) of 0.221 and weighted average of 93.0%, a difference of 2.0%.
10th Grade Correlation Summary
| Measurement | Romanian | Immigrants from Cameroon |
| Minimum | 84.6% | 81.8% |
| Maximum | 100.0% | 100.0% |
| Range | 15.4% | 18.2% |
| Mean | 96.8% | 93.7% |
| Median | 96.9% | 93.9% |
| Interquartile 25% (IQ1) | 95.3% | 91.6% |
| Interquartile 75% (IQ3) | 99.4% | 96.2% |
| Interquartile Range (IQR) | 4.1% | 4.6% |
| Standard Deviation (Sample) | 3.1% | 3.7% |
| Standard Deviation (Population) | 3.0% | 3.6% |
Similar Demographics by 10th Grade
Demographics Similar to Romanians by 10th Grade
In terms of 10th grade, the demographic groups most similar to Romanians are Immigrants from South Africa (94.8%, a difference of 0.0%), Okinawan (94.8%, a difference of 0.010%), Bhutanese (94.9%, a difference of 0.040%), Canadian (94.9%, a difference of 0.040%), and Immigrants from Sweden (94.9%, a difference of 0.050%).
| Demographics | Rating | Rank | 10th Grade |
| Immigrants | England | 99.6 /100 | #69 | Exceptional 94.9% |
| Zimbabweans | 99.6 /100 | #70 | Exceptional 94.9% |
| Alaska Natives | 99.6 /100 | #71 | Exceptional 94.9% |
| Immigrants | Sweden | 99.6 /100 | #72 | Exceptional 94.9% |
| Bhutanese | 99.6 /100 | #73 | Exceptional 94.9% |
| Canadians | 99.6 /100 | #74 | Exceptional 94.9% |
| Okinawans | 99.5 /100 | #75 | Exceptional 94.8% |
| Romanians | 99.5 /100 | #76 | Exceptional 94.8% |
| Immigrants | South Africa | 99.5 /100 | #77 | Exceptional 94.8% |
| Filipinos | 99.3 /100 | #78 | Exceptional 94.8% |
| Immigrants | Czechoslovakia | 99.2 /100 | #79 | Exceptional 94.7% |
| Immigrants | Denmark | 99.2 /100 | #80 | Exceptional 94.7% |
| Immigrants | Latvia | 99.2 /100 | #81 | Exceptional 94.7% |
| Swiss | 99.1 /100 | #82 | Exceptional 94.7% |
| Immigrants | Western Europe | 99.1 /100 | #83 | Exceptional 94.7% |
Demographics Similar to Immigrants from Cameroon by 10th Grade
In terms of 10th grade, the demographic groups most similar to Immigrants from Cameroon are Immigrants from Somalia (93.0%, a difference of 0.0%), Senegalese (93.0%, a difference of 0.020%), Spanish American (92.9%, a difference of 0.050%), Uruguayan (92.9%, a difference of 0.080%), and Immigrants from Middle Africa (92.9%, a difference of 0.10%).
| Demographics | Rating | Rank | 10th Grade |
| Africans | 4.6 /100 | #235 | Tragic 93.1% |
| Afghans | 4.5 /100 | #236 | Tragic 93.1% |
| Immigrants | Panama | 4.3 /100 | #237 | Tragic 93.1% |
| Nigerians | 4.2 /100 | #238 | Tragic 93.1% |
| Costa Ricans | 4.2 /100 | #239 | Tragic 93.1% |
| Immigrants | Hong Kong | 4.2 /100 | #240 | Tragic 93.1% |
| Immigrants | Somalia | 2.7 /100 | #241 | Tragic 93.0% |
| Immigrants | Cameroon | 2.6 /100 | #242 | Tragic 93.0% |
| Senegalese | 2.4 /100 | #243 | Tragic 93.0% |
| Spanish Americans | 2.1 /100 | #244 | Tragic 92.9% |
| Uruguayans | 1.8 /100 | #245 | Tragic 92.9% |
| Immigrants | Middle Africa | 1.7 /100 | #246 | Tragic 92.9% |
| Immigrants | Afghanistan | 1.4 /100 | #247 | Tragic 92.8% |
| Colombians | 1.4 /100 | #248 | Tragic 92.8% |
| Immigrants | Senegal | 1.4 /100 | #249 | Tragic 92.8% |