Puget Sound Salish vs Kenyan Associate's Degree
COMPARE
Puget Sound Salish
Kenyan
Associate's Degree
Associate's Degree Comparison
Puget Sound Salish
Kenyans
40.5%
ASSOCIATE'S DEGREE
0.1/ 100
METRIC RATING
273rd/ 347
METRIC RANK
47.1%
ASSOCIATE'S DEGREE
70.6/ 100
METRIC RATING
155th/ 347
METRIC RANK
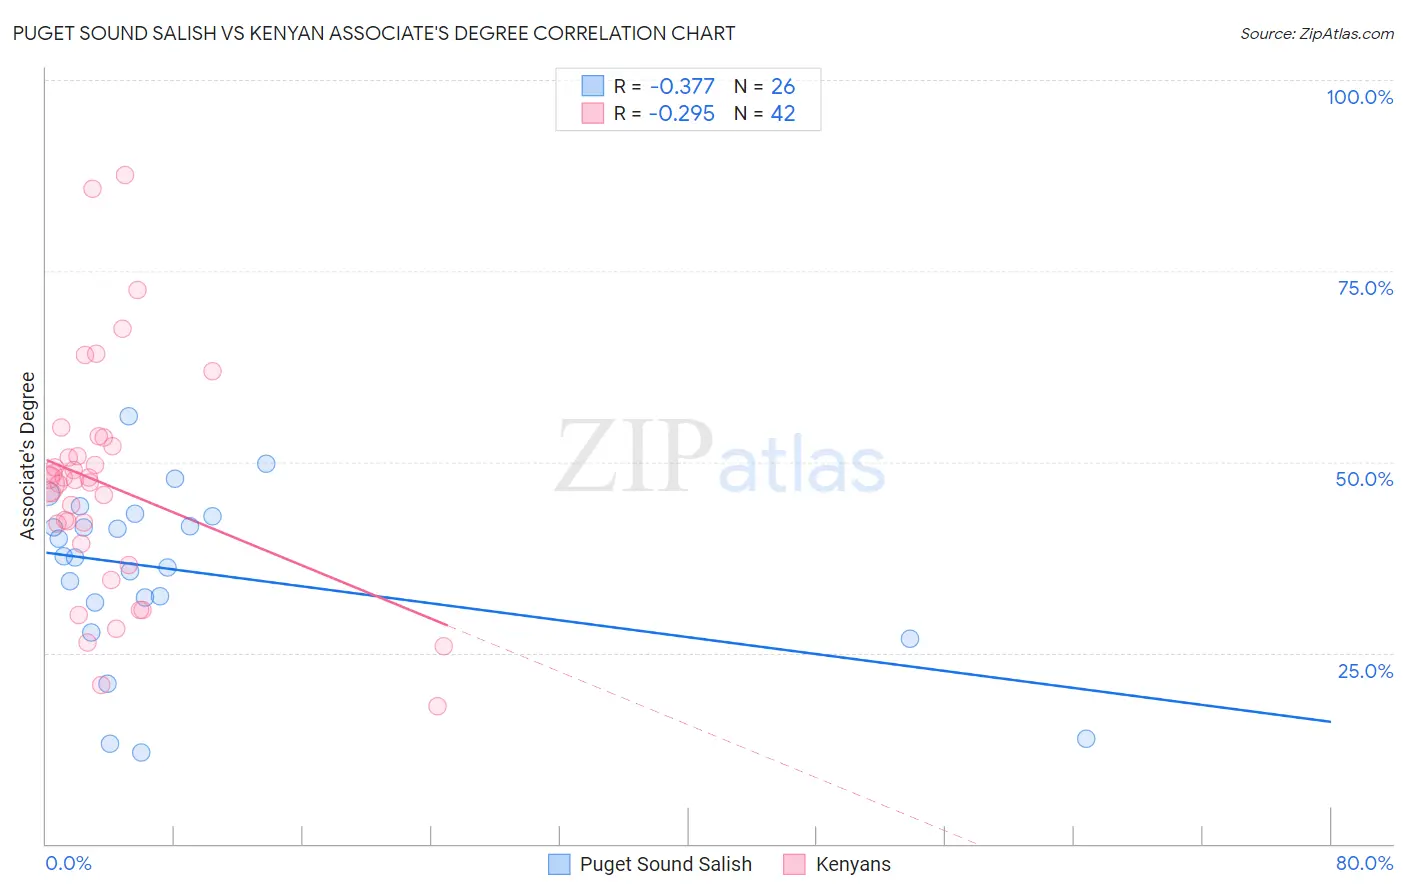
Puget Sound Salish vs Kenyan Associate's Degree Correlation Chart
The statistical analysis conducted on geographies consisting of 46,155,865 people shows a mild negative correlation between the proportion of Puget Sound Salish and percentage of population with at least associate's degree education in the United States with a correlation coefficient (R) of -0.377 and weighted average of 40.5%. Similarly, the statistical analysis conducted on geographies consisting of 168,244,481 people shows a weak negative correlation between the proportion of Kenyans and percentage of population with at least associate's degree education in the United States with a correlation coefficient (R) of -0.295 and weighted average of 47.1%, a difference of 16.3%.
Associate's Degree Correlation Summary
| Measurement | Puget Sound Salish | Kenyan |
| Minimum | 11.9% | 18.0% |
| Maximum | 56.0% | 87.6% |
| Range | 44.1% | 69.6% |
| Mean | 35.7% | 47.0% |
| Median | 37.6% | 47.5% |
| Interquartile 25% (IQ1) | 31.6% | 39.3% |
| Interquartile 75% (IQ3) | 42.9% | 52.1% |
| Interquartile Range (IQR) | 11.2% | 12.8% |
| Standard Deviation (Sample) | 11.2% | 15.0% |
| Standard Deviation (Population) | 11.0% | 14.8% |
Similar Demographics by Associate's Degree
Demographics Similar to Puget Sound Salish by Associate's Degree
In terms of associate's degree, the demographic groups most similar to Puget Sound Salish are Immigrants from Dominica (40.5%, a difference of 0.14%), Potawatomi (40.4%, a difference of 0.28%), Belizean (40.6%, a difference of 0.29%), Immigrants from Laos (40.7%, a difference of 0.36%), and Puerto Rican (40.4%, a difference of 0.38%).
| Demographics | Rating | Rank | Associate's Degree |
| Samoans | 0.2 /100 | #266 | Tragic 41.1% |
| Hawaiians | 0.2 /100 | #267 | Tragic 40.9% |
| Central American Indians | 0.2 /100 | #268 | Tragic 40.8% |
| Americans | 0.2 /100 | #269 | Tragic 40.8% |
| Chippewa | 0.2 /100 | #270 | Tragic 40.7% |
| Immigrants | Laos | 0.1 /100 | #271 | Tragic 40.7% |
| Belizeans | 0.1 /100 | #272 | Tragic 40.6% |
| Puget Sound Salish | 0.1 /100 | #273 | Tragic 40.5% |
| Immigrants | Dominica | 0.1 /100 | #274 | Tragic 40.5% |
| Potawatomi | 0.1 /100 | #275 | Tragic 40.4% |
| Puerto Ricans | 0.1 /100 | #276 | Tragic 40.4% |
| Blackfeet | 0.1 /100 | #277 | Tragic 40.3% |
| Ottawa | 0.1 /100 | #278 | Tragic 40.3% |
| Immigrants | Nicaragua | 0.1 /100 | #279 | Tragic 40.3% |
| Immigrants | Micronesia | 0.1 /100 | #280 | Tragic 40.2% |
Demographics Similar to Kenyans by Associate's Degree
In terms of associate's degree, the demographic groups most similar to Kenyans are South American (47.1%, a difference of 0.010%), Sudanese (47.1%, a difference of 0.030%), Immigrants from Germany (47.1%, a difference of 0.080%), Immigrants from Kenya (47.2%, a difference of 0.13%), and Immigrants from Poland (47.1%, a difference of 0.13%).
| Demographics | Rating | Rank | Associate's Degree |
| South American Indians | 76.7 /100 | #148 | Good 47.4% |
| Immigrants | Armenia | 76.6 /100 | #149 | Good 47.4% |
| Iraqis | 76.2 /100 | #150 | Good 47.4% |
| Immigrants | North Macedonia | 76.0 /100 | #151 | Good 47.4% |
| Immigrants | Afghanistan | 74.3 /100 | #152 | Good 47.3% |
| Czechs | 72.2 /100 | #153 | Good 47.2% |
| Immigrants | Kenya | 72.1 /100 | #154 | Good 47.2% |
| Kenyans | 70.6 /100 | #155 | Good 47.1% |
| South Americans | 70.5 /100 | #156 | Good 47.1% |
| Sudanese | 70.3 /100 | #157 | Good 47.1% |
| Immigrants | Germany | 69.7 /100 | #158 | Good 47.1% |
| Immigrants | Poland | 69.2 /100 | #159 | Good 47.1% |
| Scottish | 65.4 /100 | #160 | Good 46.9% |
| Scandinavians | 65.2 /100 | #161 | Good 46.9% |
| Immigrants | Africa | 63.2 /100 | #162 | Good 46.8% |