Puerto Rican vs Maltese Professional Degree
COMPARE
Puerto Rican
Maltese
Professional Degree
Professional Degree Comparison
Puerto Ricans
Maltese
3.2%
PROFESSIONAL DEGREE
0.1/ 100
METRIC RATING
316th/ 347
METRIC RANK
5.0%
PROFESSIONAL DEGREE
98.1/ 100
METRIC RATING
107th/ 347
METRIC RANK
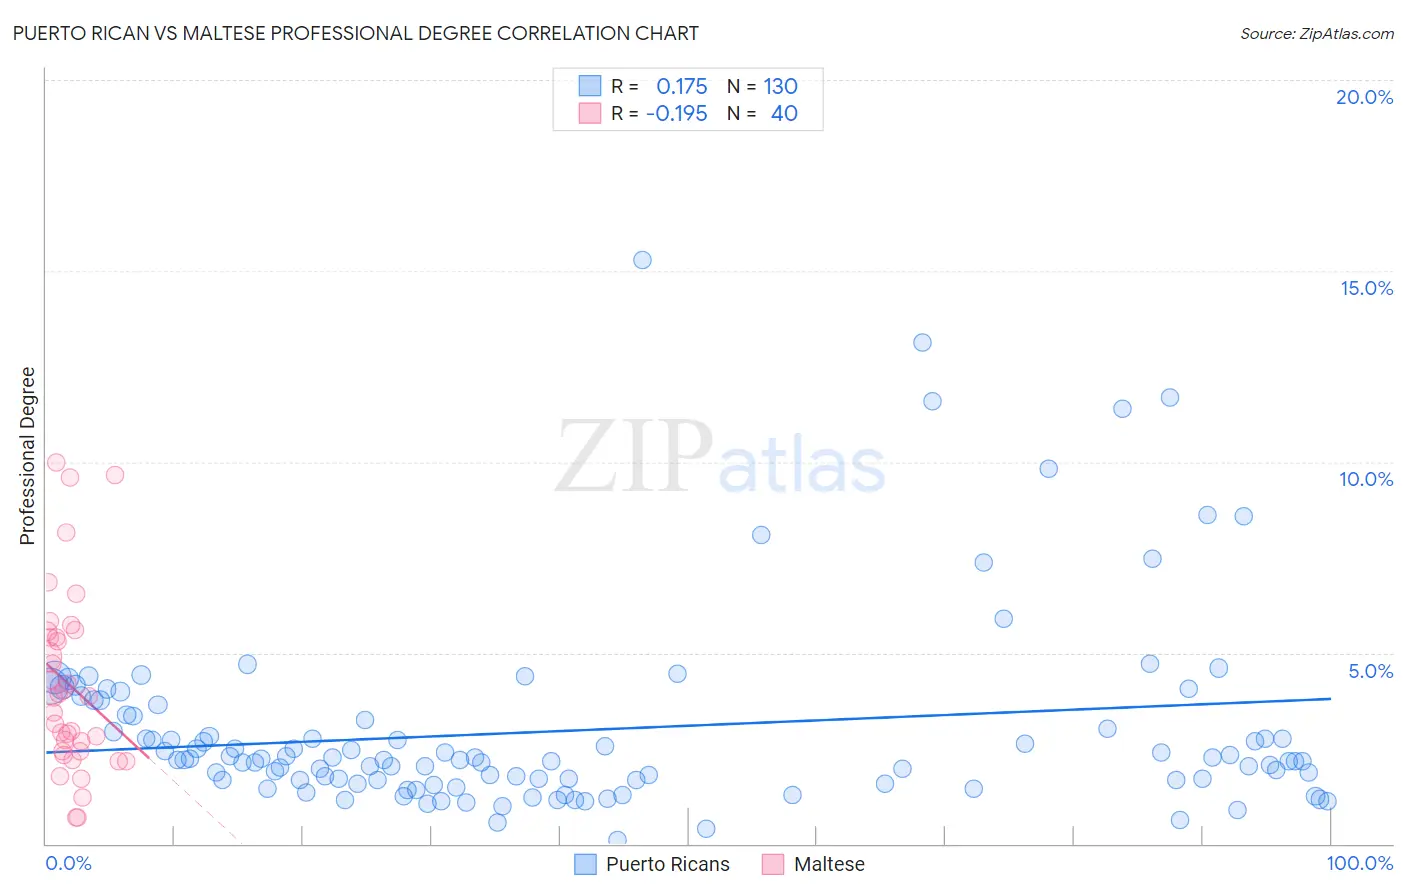
Puerto Rican vs Maltese Professional Degree Correlation Chart
The statistical analysis conducted on geographies consisting of 524,505,340 people shows a poor positive correlation between the proportion of Puerto Ricans and percentage of population with at least professional degree education in the United States with a correlation coefficient (R) of 0.175 and weighted average of 3.2%. Similarly, the statistical analysis conducted on geographies consisting of 126,398,771 people shows a poor negative correlation between the proportion of Maltese and percentage of population with at least professional degree education in the United States with a correlation coefficient (R) of -0.195 and weighted average of 5.0%, a difference of 55.2%.
Professional Degree Correlation Summary
| Measurement | Puerto Rican | Maltese |
| Minimum | 0.087% | 0.68% |
| Maximum | 15.3% | 10.0% |
| Range | 15.2% | 9.3% |
| Mean | 3.0% | 4.2% |
| Median | 2.2% | 3.9% |
| Interquartile 25% (IQ1) | 1.7% | 2.4% |
| Interquartile 75% (IQ3) | 3.3% | 5.5% |
| Interquartile Range (IQR) | 1.7% | 3.1% |
| Standard Deviation (Sample) | 2.6% | 2.4% |
| Standard Deviation (Population) | 2.5% | 2.3% |
Similar Demographics by Professional Degree
Demographics Similar to Puerto Ricans by Professional Degree
In terms of professional degree, the demographic groups most similar to Puerto Ricans are Immigrants from Laos (3.2%, a difference of 0.010%), Nepalese (3.2%, a difference of 0.21%), Immigrants from Micronesia (3.2%, a difference of 0.24%), Choctaw (3.2%, a difference of 0.48%), and Mexican American Indian (3.3%, a difference of 0.69%).
| Demographics | Rating | Rank | Professional Degree |
| Pima | 0.1 /100 | #309 | Tragic 3.3% |
| Immigrants | Latin America | 0.1 /100 | #310 | Tragic 3.3% |
| Cherokee | 0.1 /100 | #311 | Tragic 3.3% |
| Sioux | 0.1 /100 | #312 | Tragic 3.3% |
| Yuman | 0.1 /100 | #313 | Tragic 3.3% |
| Mexican American Indians | 0.1 /100 | #314 | Tragic 3.3% |
| Immigrants | Laos | 0.1 /100 | #315 | Tragic 3.2% |
| Puerto Ricans | 0.1 /100 | #316 | Tragic 3.2% |
| Nepalese | 0.1 /100 | #317 | Tragic 3.2% |
| Immigrants | Micronesia | 0.1 /100 | #318 | Tragic 3.2% |
| Choctaw | 0.1 /100 | #319 | Tragic 3.2% |
| Seminole | 0.1 /100 | #320 | Tragic 3.2% |
| Tsimshian | 0.0 /100 | #321 | Tragic 3.2% |
| Hispanics or Latinos | 0.0 /100 | #322 | Tragic 3.2% |
| Inupiat | 0.0 /100 | #323 | Tragic 3.2% |
Demographics Similar to Maltese by Professional Degree
In terms of professional degree, the demographic groups most similar to Maltese are Immigrants from Southern Europe (5.0%, a difference of 0.040%), British (5.0%, a difference of 0.060%), Immigrants from Ukraine (5.0%, a difference of 0.12%), Immigrants from Uganda (5.0%, a difference of 0.15%), and Arab (5.0%, a difference of 0.17%).
| Demographics | Rating | Rank | Professional Degree |
| Ugandans | 98.8 /100 | #100 | Exceptional 5.1% |
| Immigrants | Egypt | 98.5 /100 | #101 | Exceptional 5.1% |
| Ukrainians | 98.5 /100 | #102 | Exceptional 5.1% |
| Immigrants | Northern Africa | 98.4 /100 | #103 | Exceptional 5.1% |
| Arabs | 98.2 /100 | #104 | Exceptional 5.0% |
| Immigrants | Uganda | 98.2 /100 | #105 | Exceptional 5.0% |
| Immigrants | Ukraine | 98.2 /100 | #106 | Exceptional 5.0% |
| Maltese | 98.1 /100 | #107 | Exceptional 5.0% |
| Immigrants | Southern Europe | 98.1 /100 | #108 | Exceptional 5.0% |
| British | 98.0 /100 | #109 | Exceptional 5.0% |
| Lebanese | 98.0 /100 | #110 | Exceptional 5.0% |
| Brazilians | 97.4 /100 | #111 | Exceptional 5.0% |
| Taiwanese | 97.3 /100 | #112 | Exceptional 5.0% |
| Immigrants | Pakistan | 97.2 /100 | #113 | Exceptional 5.0% |
| Immigrants | Morocco | 96.8 /100 | #114 | Exceptional 5.0% |