Pueblo vs Cape Verdean 11th Grade
COMPARE
Pueblo
Cape Verdean
11th Grade
11th Grade Comparison
Pueblo
Cape Verdeans
91.2%
11TH GRADE
0.3/ 100
METRIC RATING
265th/ 347
METRIC RANK
89.1%
11TH GRADE
0.0/ 100
METRIC RATING
314th/ 347
METRIC RANK
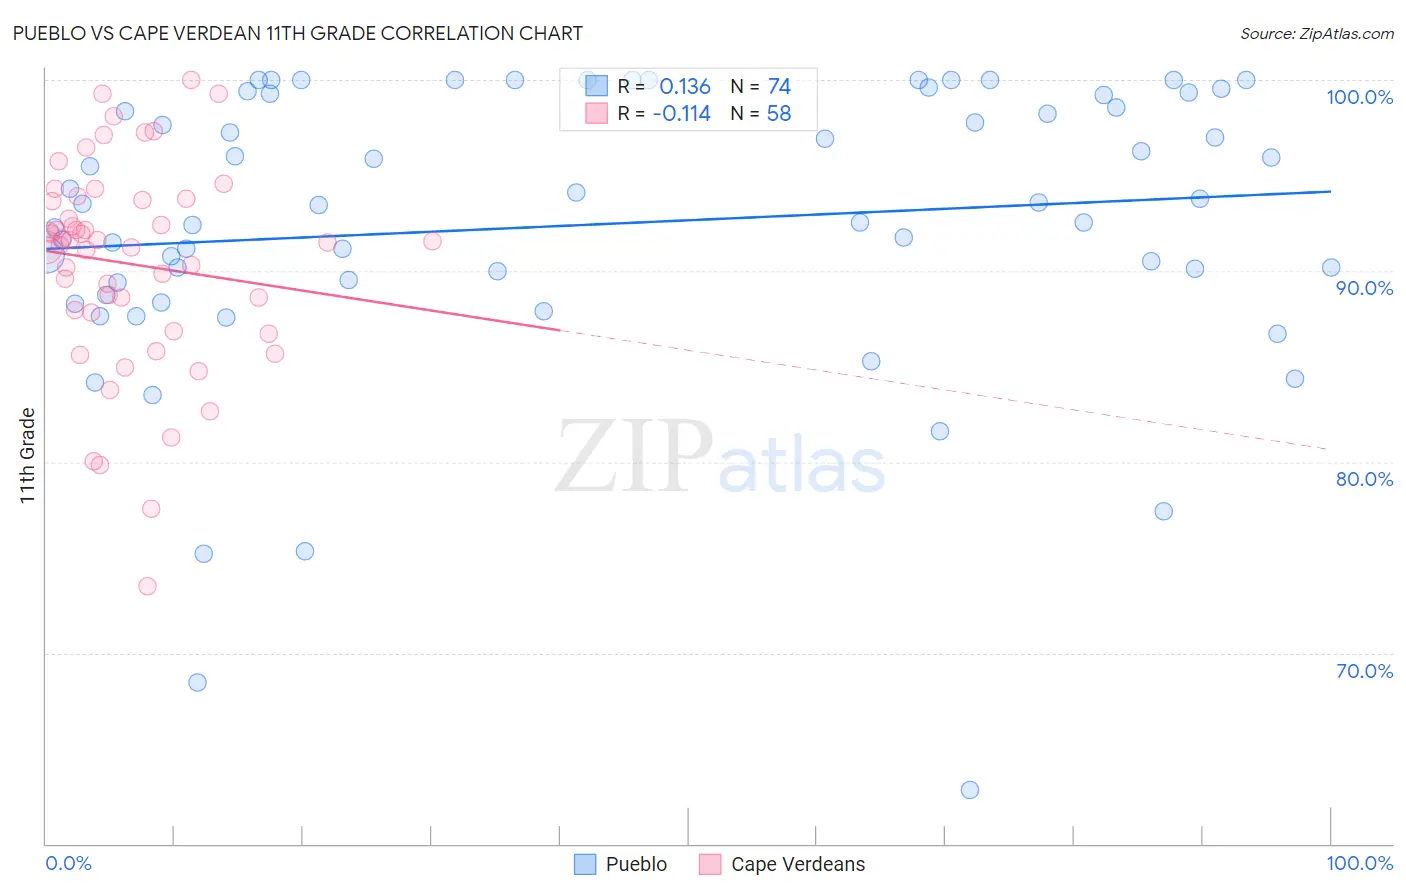
Pueblo vs Cape Verdean 11th Grade Correlation Chart
The statistical analysis conducted on geographies consisting of 120,086,593 people shows a poor positive correlation between the proportion of Pueblo and percentage of population with at least 11th grade education in the United States with a correlation coefficient (R) of 0.136 and weighted average of 91.2%. Similarly, the statistical analysis conducted on geographies consisting of 107,537,955 people shows a poor negative correlation between the proportion of Cape Verdeans and percentage of population with at least 11th grade education in the United States with a correlation coefficient (R) of -0.114 and weighted average of 89.1%, a difference of 2.4%.
11th Grade Correlation Summary
| Measurement | Pueblo | Cape Verdean |
| Minimum | 62.8% | 73.5% |
| Maximum | 100.0% | 100.0% |
| Range | 37.2% | 26.5% |
| Mean | 92.4% | 90.4% |
| Median | 93.5% | 91.5% |
| Interquartile 25% (IQ1) | 89.4% | 87.8% |
| Interquartile 75% (IQ3) | 99.2% | 93.7% |
| Interquartile Range (IQR) | 9.8% | 5.9% |
| Standard Deviation (Sample) | 7.6% | 5.4% |
| Standard Deviation (Population) | 7.5% | 5.4% |
Similar Demographics by 11th Grade
Demographics Similar to Pueblo by 11th Grade
In terms of 11th grade, the demographic groups most similar to Pueblo are Yup'ik (91.2%, a difference of 0.0%), Immigrants from Ghana (91.2%, a difference of 0.020%), Immigrants from Western Africa (91.2%, a difference of 0.020%), Immigrants from Jamaica (91.2%, a difference of 0.030%), and U.S. Virgin Islander (91.1%, a difference of 0.10%).
| Demographics | Rating | Rank | 11th Grade |
| Immigrants | Colombia | 0.6 /100 | #258 | Tragic 91.4% |
| Jamaicans | 0.6 /100 | #259 | Tragic 91.4% |
| Spanish Americans | 0.6 /100 | #260 | Tragic 91.4% |
| Taiwanese | 0.6 /100 | #261 | Tragic 91.3% |
| Immigrants | Uruguay | 0.5 /100 | #262 | Tragic 91.3% |
| Immigrants | Ghana | 0.3 /100 | #263 | Tragic 91.2% |
| Yup'ik | 0.3 /100 | #264 | Tragic 91.2% |
| Pueblo | 0.3 /100 | #265 | Tragic 91.2% |
| Immigrants | Western Africa | 0.3 /100 | #266 | Tragic 91.2% |
| Immigrants | Jamaica | 0.3 /100 | #267 | Tragic 91.2% |
| U.S. Virgin Islanders | 0.2 /100 | #268 | Tragic 91.1% |
| Ute | 0.2 /100 | #269 | Tragic 91.1% |
| Trinidadians and Tobagonians | 0.2 /100 | #270 | Tragic 91.1% |
| Immigrants | Peru | 0.1 /100 | #271 | Tragic 91.0% |
| West Indians | 0.1 /100 | #272 | Tragic 91.0% |
Demographics Similar to Cape Verdeans by 11th Grade
In terms of 11th grade, the demographic groups most similar to Cape Verdeans are Immigrants from Ecuador (89.1%, a difference of 0.010%), Immigrants from Caribbean (89.1%, a difference of 0.020%), Immigrants from Cuba (88.9%, a difference of 0.16%), Lumbee (88.9%, a difference of 0.17%), and Immigrants from Portugal (89.3%, a difference of 0.22%).
| Demographics | Rating | Rank | 11th Grade |
| Immigrants | Dominica | 0.0 /100 | #307 | Tragic 89.5% |
| Nepalese | 0.0 /100 | #308 | Tragic 89.5% |
| Immigrants | Bangladesh | 0.0 /100 | #309 | Tragic 89.5% |
| Yaqui | 0.0 /100 | #310 | Tragic 89.5% |
| Vietnamese | 0.0 /100 | #311 | Tragic 89.4% |
| Immigrants | Portugal | 0.0 /100 | #312 | Tragic 89.3% |
| Immigrants | Caribbean | 0.0 /100 | #313 | Tragic 89.1% |
| Cape Verdeans | 0.0 /100 | #314 | Tragic 89.1% |
| Immigrants | Ecuador | 0.0 /100 | #315 | Tragic 89.1% |
| Immigrants | Cuba | 0.0 /100 | #316 | Tragic 88.9% |
| Lumbee | 0.0 /100 | #317 | Tragic 88.9% |
| Nicaraguans | 0.0 /100 | #318 | Tragic 88.9% |
| Belizeans | 0.0 /100 | #319 | Tragic 88.8% |
| Immigrants | Armenia | 0.0 /100 | #320 | Tragic 88.8% |
| Immigrants | Belize | 0.0 /100 | #321 | Tragic 88.7% |