Potawatomi vs Immigrants from Nigeria Doctorate Degree
COMPARE
Potawatomi
Immigrants from Nigeria
Doctorate Degree
Doctorate Degree Comparison
Potawatomi
Immigrants from Nigeria
1.6%
DOCTORATE DEGREE
1.6/ 100
METRIC RATING
249th/ 347
METRIC RANK
1.8%
DOCTORATE DEGREE
22.4/ 100
METRIC RATING
201st/ 347
METRIC RANK
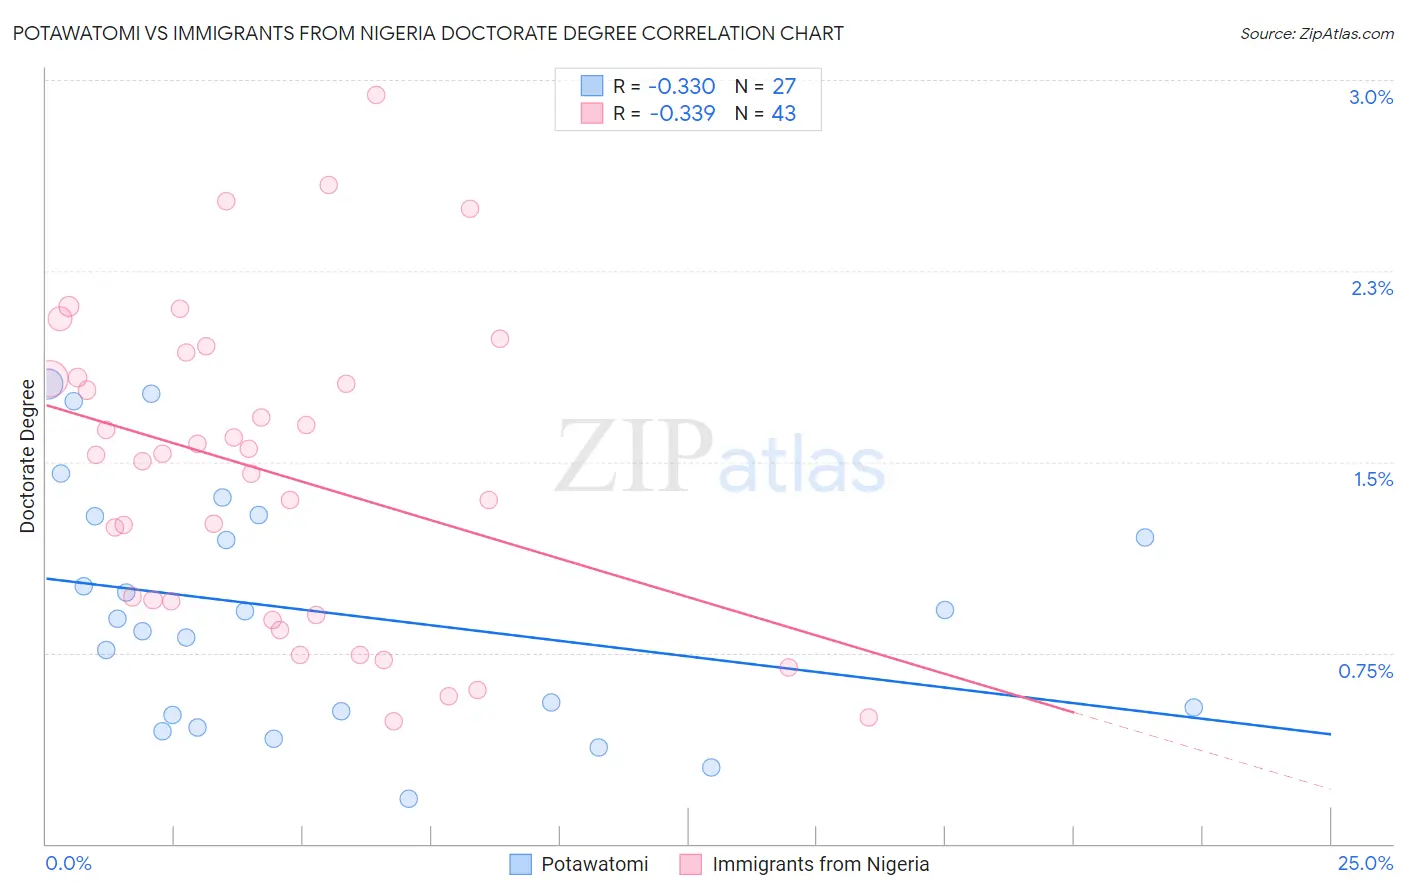
Potawatomi vs Immigrants from Nigeria Doctorate Degree Correlation Chart
The statistical analysis conducted on geographies consisting of 116,746,073 people shows a mild negative correlation between the proportion of Potawatomi and percentage of population with at least doctorate degree education in the United States with a correlation coefficient (R) of -0.330 and weighted average of 1.6%. Similarly, the statistical analysis conducted on geographies consisting of 282,146,765 people shows a mild negative correlation between the proportion of Immigrants from Nigeria and percentage of population with at least doctorate degree education in the United States with a correlation coefficient (R) of -0.339 and weighted average of 1.8%, a difference of 12.4%.
Doctorate Degree Correlation Summary
| Measurement | Potawatomi | Immigrants from Nigeria |
| Minimum | 0.18% | 0.48% |
| Maximum | 1.8% | 2.9% |
| Range | 1.6% | 2.5% |
| Mean | 0.91% | 1.5% |
| Median | 0.88% | 1.5% |
| Interquartile 25% (IQ1) | 0.51% | 0.90% |
| Interquartile 75% (IQ3) | 1.3% | 1.8% |
| Interquartile Range (IQR) | 0.78% | 0.93% |
| Standard Deviation (Sample) | 0.47% | 0.61% |
| Standard Deviation (Population) | 0.46% | 0.61% |
Similar Demographics by Doctorate Degree
Demographics Similar to Potawatomi by Doctorate Degree
In terms of doctorate degree, the demographic groups most similar to Potawatomi are Immigrants from Fiji (1.6%, a difference of 0.030%), African (1.6%, a difference of 0.47%), Comanche (1.6%, a difference of 0.59%), Hmong (1.6%, a difference of 0.61%), and Delaware (1.6%, a difference of 0.70%).
| Demographics | Rating | Rank | Doctorate Degree |
| Ottawa | 2.2 /100 | #242 | Tragic 1.6% |
| Native Hawaiians | 2.1 /100 | #243 | Tragic 1.6% |
| French American Indians | 2.0 /100 | #244 | Tragic 1.6% |
| Delaware | 1.9 /100 | #245 | Tragic 1.6% |
| Hmong | 1.8 /100 | #246 | Tragic 1.6% |
| Comanche | 1.8 /100 | #247 | Tragic 1.6% |
| Africans | 1.8 /100 | #248 | Tragic 1.6% |
| Potawatomi | 1.6 /100 | #249 | Tragic 1.6% |
| Immigrants | Fiji | 1.6 /100 | #250 | Tragic 1.6% |
| Apache | 1.3 /100 | #251 | Tragic 1.5% |
| Yuman | 1.1 /100 | #252 | Tragic 1.5% |
| Americans | 1.0 /100 | #253 | Tragic 1.5% |
| Immigrants | Cambodia | 1.0 /100 | #254 | Tragic 1.5% |
| Trinidadians and Tobagonians | 1.0 /100 | #255 | Tragic 1.5% |
| Central American Indians | 1.0 /100 | #256 | Tragic 1.5% |
Demographics Similar to Immigrants from Nigeria by Doctorate Degree
In terms of doctorate degree, the demographic groups most similar to Immigrants from Nigeria are White/Caucasian (1.8%, a difference of 0.070%), Immigrants from South America (1.8%, a difference of 0.18%), Portuguese (1.8%, a difference of 0.23%), Immigrants from Vietnam (1.8%, a difference of 0.25%), and Somali (1.7%, a difference of 0.28%).
| Demographics | Rating | Rank | Doctorate Degree |
| Uruguayans | 26.2 /100 | #194 | Fair 1.8% |
| Immigrants | Somalia | 25.4 /100 | #195 | Fair 1.8% |
| Sub-Saharan Africans | 25.1 /100 | #196 | Fair 1.8% |
| Chinese | 25.1 /100 | #197 | Fair 1.8% |
| Immigrants | Ghana | 24.6 /100 | #198 | Fair 1.8% |
| Immigrants | South America | 23.3 /100 | #199 | Fair 1.8% |
| Whites/Caucasians | 22.8 /100 | #200 | Fair 1.8% |
| Immigrants | Nigeria | 22.4 /100 | #201 | Fair 1.8% |
| Portuguese | 21.4 /100 | #202 | Fair 1.8% |
| Immigrants | Vietnam | 21.4 /100 | #203 | Fair 1.8% |
| Somalis | 21.2 /100 | #204 | Fair 1.7% |
| Venezuelans | 19.5 /100 | #205 | Poor 1.7% |
| Immigrants | Peru | 17.6 /100 | #206 | Poor 1.7% |
| Yugoslavians | 17.1 /100 | #207 | Poor 1.7% |
| Colombians | 16.1 /100 | #208 | Poor 1.7% |