Polish vs South American Indian 11th Grade
COMPARE
Polish
South American Indian
11th Grade
11th Grade Comparison
Poles
South American Indians
94.8%
11TH GRADE
100.0/ 100
METRIC RATING
7th/ 347
METRIC RANK
92.0%
11TH GRADE
7.6/ 100
METRIC RATING
220th/ 347
METRIC RANK
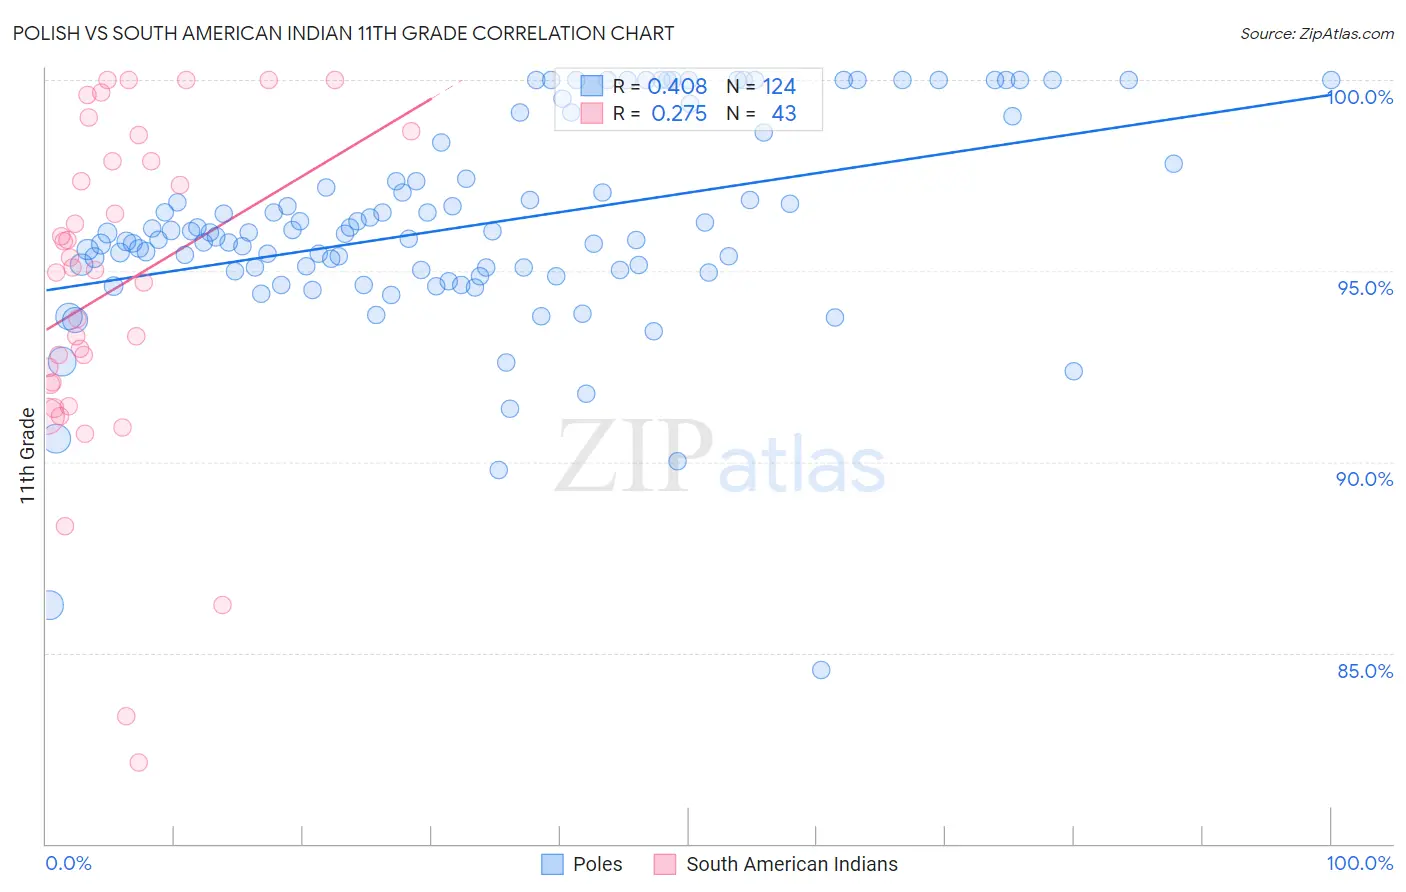
Polish vs South American Indian 11th Grade Correlation Chart
The statistical analysis conducted on geographies consisting of 560,594,575 people shows a moderate positive correlation between the proportion of Poles and percentage of population with at least 11th grade education in the United States with a correlation coefficient (R) of 0.408 and weighted average of 94.8%. Similarly, the statistical analysis conducted on geographies consisting of 164,573,401 people shows a weak positive correlation between the proportion of South American Indians and percentage of population with at least 11th grade education in the United States with a correlation coefficient (R) of 0.275 and weighted average of 92.0%, a difference of 3.0%.
11th Grade Correlation Summary
| Measurement | Polish | South American Indian |
| Minimum | 84.5% | 82.1% |
| Maximum | 100.0% | 100.0% |
| Range | 15.5% | 17.9% |
| Mean | 96.2% | 94.5% |
| Median | 96.0% | 95.0% |
| Interquartile 25% (IQ1) | 95.0% | 92.0% |
| Interquartile 75% (IQ3) | 97.6% | 97.9% |
| Interquartile Range (IQR) | 2.6% | 5.8% |
| Standard Deviation (Sample) | 2.7% | 4.3% |
| Standard Deviation (Population) | 2.7% | 4.3% |
Similar Demographics by 11th Grade
Demographics Similar to Poles by 11th Grade
In terms of 11th grade, the demographic groups most similar to Poles are Croatian (94.7%, a difference of 0.010%), Lithuanian (94.8%, a difference of 0.050%), Danish (94.7%, a difference of 0.050%), Finnish (94.7%, a difference of 0.090%), and Carpatho Rusyn (94.8%, a difference of 0.10%).
| Demographics | Rating | Rank | 11th Grade |
| Norwegians | 100.0 /100 | #1 | Exceptional 95.2% |
| Swedes | 100.0 /100 | #2 | Exceptional 94.9% |
| Slovenes | 100.0 /100 | #3 | Exceptional 94.9% |
| Slovaks | 100.0 /100 | #4 | Exceptional 94.9% |
| Carpatho Rusyns | 100.0 /100 | #5 | Exceptional 94.8% |
| Lithuanians | 100.0 /100 | #6 | Exceptional 94.8% |
| Poles | 100.0 /100 | #7 | Exceptional 94.8% |
| Croatians | 100.0 /100 | #8 | Exceptional 94.7% |
| Danes | 100.0 /100 | #9 | Exceptional 94.7% |
| Finns | 100.0 /100 | #10 | Exceptional 94.7% |
| Germans | 100.0 /100 | #11 | Exceptional 94.7% |
| Latvians | 100.0 /100 | #12 | Exceptional 94.7% |
| Chinese | 100.0 /100 | #13 | Exceptional 94.6% |
| Eastern Europeans | 100.0 /100 | #14 | Exceptional 94.6% |
| Bulgarians | 100.0 /100 | #15 | Exceptional 94.5% |
Demographics Similar to South American Indians by 11th Grade
In terms of 11th grade, the demographic groups most similar to South American Indians are Immigrants from Liberia (91.9%, a difference of 0.020%), Immigrants from Africa (91.9%, a difference of 0.040%), Immigrants from Bahamas (91.9%, a difference of 0.040%), Costa Rican (91.9%, a difference of 0.050%), and Portuguese (92.0%, a difference of 0.070%).
| Demographics | Rating | Rank | 11th Grade |
| Immigrants | Ethiopia | 13.9 /100 | #213 | Poor 92.1% |
| Afghans | 12.8 /100 | #214 | Poor 92.1% |
| Immigrants | Southern Europe | 12.5 /100 | #215 | Poor 92.1% |
| Somalis | 11.6 /100 | #216 | Poor 92.1% |
| Immigrants | Sierra Leone | 11.1 /100 | #217 | Poor 92.0% |
| Blackfeet | 10.1 /100 | #218 | Poor 92.0% |
| Portuguese | 10.0 /100 | #219 | Tragic 92.0% |
| South American Indians | 7.6 /100 | #220 | Tragic 92.0% |
| Immigrants | Liberia | 7.0 /100 | #221 | Tragic 91.9% |
| Immigrants | Africa | 6.5 /100 | #222 | Tragic 91.9% |
| Immigrants | Bahamas | 6.5 /100 | #223 | Tragic 91.9% |
| Costa Ricans | 6.3 /100 | #224 | Tragic 91.9% |
| Immigrants | Zaire | 5.4 /100 | #225 | Tragic 91.9% |
| Immigrants | Somalia | 5.2 /100 | #226 | Tragic 91.9% |
| Immigrants | Cameroon | 4.4 /100 | #227 | Tragic 91.8% |