Pima vs Immigrants 3rd Grade

COMPARE

Pima
Race
Ancestry
AfghanAfricanAlaska NativeAlaskan AthabascanAlbanianAleutAlsatianAmericanApacheArabArapahoArgentineanArmenianAssyrian/Chaldean/SyriacAustralianAustrianBahamianBangladeshiBarbadianBasqueBelgianBelizeanBermudanBhutaneseBlackfeetBolivianBrazilianBritishBritish West IndianBulgarianBurmeseCajunCambodianCanadianCape VerdeanCarpatho RusynCelticCentral AmericanCentral American IndianCherokeeCheyenneChickasawChileanChineseChippewaChoctawColombianColvilleComancheCosta RicanCreeCreekCroatianCrowCubanCypriotCzechCzechoslovakianDanishDelawareDominicanDutchDutch West IndianEastern EuropeanEcuadorianEgyptianEnglishEstonianEthiopianEuropeanFijianFilipinoFinnishFrenchFrench American IndianFrench CanadianGermanGerman RussianGhanaianGreekGuamanian/ChamorroGuatemalanGuyaneseHaitianHmongHonduranHopiHoumaHungarianIcelanderIndian (Asian)IndonesianInupiatIranianIraqiIrishIroquoisIsraeliItalianJamaicanJapaneseJordanianKenyanKiowaKoreanLaotianLatvianLebaneseLiberianLithuanianLumbeeLuxembourgerMacedonianMalaysianMalteseMarshalleseMenomineeMexicanMexican American IndianMongolianMoroccanNative HawaiianNavajoNepaleseNew ZealanderNicaraguanNigerianNorthern EuropeanNorwegianOkinawanOsageOttawaPaiutePakistaniPalestinianPanamanianParaguayanPennsylvania GermanPeruvianPimaPolishPortuguesePotawatomiPuebloPuerto RicanPuget Sound SalishRomanianRussianSalvadoranSamoanScandinavianScotch-IrishScottishSeminoleSenegaleseSerbianShoshoneSierra LeoneanSiouxSlavicSlovakSloveneSomaliSouth AfricanSouth AmericanSouth American IndianSoviet UnionSpaniardSpanishSpanish AmericanSpanish American IndianSri LankanSubsaharan AfricanSudaneseSwedishSwissSyrianTaiwaneseThaiTlingit-HaidaTohono O'OdhamTonganTrinidadian and TobagonianTsimshianTurkishU.S. Virgin IslanderUgandanUkrainianUruguayanUteVenezuelanVietnameseWelshWest IndianYakamaYaquiYugoslavianYumanYup'ikZimbabwean
Immigration
NonimmigrantsAfghanistanAfricaAlbaniaArgentinaArmeniaAsiaAustraliaAustriaBahamasBangladeshBarbadosBelarusBelgiumBelizeBoliviaBosnia and HerzegovinaBrazilBulgariaBurma/MyanmarCabo VerdeCambodiaCameroonCanadaCaribbeanCentral AmericaChileChinaColombiaCongoCosta RicaCroatiaCubaCzechoslovakiaDenmarkDominicaDominican RepublicEastern AfricaEastern AsiaEastern EuropeEcuadorEgyptEl SalvadorEnglandEritreaEthiopiaEuropeFijiFranceGermanyGhanaGreeceGrenadaGuatemalaGuyanaHaitiHondurasHong KongHungaryIndiaIndonesiaIranIraqIrelandIsraelItalyJamaicaJapanJordanKazakhstanKenyaKoreaKuwaitLaosLatin AmericaLatviaLebanonLiberiaLithuaniaMalaysiaMexicoMicronesiaMiddle AfricaMoldovaMoroccoNepalNetherlandsNicaraguaNigeriaNorth AmericaNorth MacedoniaNorthern AfricaNorthern EuropeNorwayOceaniaPakistanPanamaPeruPhilippinesPolandPortugalRomaniaRussiaSaudi ArabiaScotlandSenegalSerbiaSierra LeoneSingaporeSomaliaSouth AfricaSouth AmericaSouth Central AsiaSouth Eastern AsiaSouthern EuropeSpainSri LankaSt. Vincent and the GrenadinesSudanSwedenSwitzerlandSyriaTaiwanThailandTrinidad and TobagoTurkeyUgandaUkraineUruguayUzbekistanVenezuelaVietnamWest IndiesWestern AfricaWestern AsiaWestern EuropeYemenZaireZimbabweAzores
Immigrants
Race
Ancestry
AfghanAfricanAlaska NativeAlaskan AthabascanAlbanianAleutAlsatianAmericanApacheArabArapahoArgentineanArmenianAssyrian/Chaldean/SyriacAustralianAustrianBahamianBangladeshiBarbadianBasqueBelgianBelizeanBermudanBhutaneseBlackfeetBolivianBrazilianBritishBritish West IndianBulgarianBurmeseCajunCambodianCanadianCape VerdeanCarpatho RusynCelticCentral AmericanCentral American IndianCherokeeCheyenneChickasawChileanChineseChippewaChoctawColombianColvilleComancheCosta RicanCreeCreekCroatianCrowCubanCypriotCzechCzechoslovakianDanishDelawareDominicanDutchDutch West IndianEastern EuropeanEcuadorianEgyptianEnglishEstonianEthiopianEuropeanFijianFilipinoFinnishFrenchFrench American IndianFrench CanadianGermanGerman RussianGhanaianGreekGuamanian/ChamorroGuatemalanGuyaneseHaitianHmongHonduranHopiHoumaHungarianIcelanderIndian (Asian)IndonesianInupiatIranianIraqiIrishIroquoisIsraeliItalianJamaicanJapaneseJordanianKenyanKiowaKoreanLaotianLatvianLebaneseLiberianLithuanianLumbeeLuxembourgerMacedonianMalaysianMalteseMarshalleseMenomineeMexicanMexican American IndianMongolianMoroccanNative HawaiianNavajoNepaleseNew ZealanderNicaraguanNigerianNorthern EuropeanNorwegianOkinawanOsageOttawaPaiutePakistaniPalestinianPanamanianParaguayanPennsylvania GermanPeruvianPolishPortuguesePotawatomiPuebloPuerto RicanPuget Sound SalishRomanianRussianSalvadoranSamoanScandinavianScotch-IrishScottishSeminoleSenegaleseSerbianShoshoneSierra LeoneanSiouxSlavicSlovakSloveneSomaliSouth AfricanSouth AmericanSouth American IndianSoviet UnionSpaniardSpanishSpanish AmericanSpanish American IndianSri LankanSubsaharan AfricanSudaneseSwedishSwissSyrianTaiwaneseThaiTlingit-HaidaTohono O'OdhamTonganTrinidadian and TobagonianTsimshianTurkishU.S. Virgin IslanderUgandanUkrainianUruguayanUteVenezuelanVietnameseWelshWest IndianYakamaYaquiYugoslavianYumanYup'ikZimbabwean
Immigration
NonimmigrantsImmigrantsAfghanistanAfricaAlbaniaArgentinaArmeniaAsiaAustraliaAustriaBahamasBangladeshBarbadosBelarusBelgiumBelizeBoliviaBosnia and HerzegovinaBrazilBulgariaBurma/MyanmarCabo VerdeCambodiaCameroonCanadaCaribbeanCentral AmericaChileChinaColombiaCongoCosta RicaCroatiaCubaCzechoslovakiaDenmarkDominicaDominican RepublicEastern AfricaEastern AsiaEastern EuropeEcuadorEgyptEl SalvadorEnglandEritreaEthiopiaEuropeFijiFranceGermanyGhanaGreeceGrenadaGuatemalaGuyanaHaitiHondurasHong KongHungaryIndiaIndonesiaIranIraqIrelandIsraelItalyJamaicaJapanJordanKazakhstanKenyaKoreaKuwaitLaosLatin AmericaLatviaLebanonLiberiaLithuaniaMalaysiaMexicoMicronesiaMiddle AfricaMoldovaMoroccoNepalNetherlandsNicaraguaNigeriaNorth AmericaNorth MacedoniaNorthern AfricaNorthern EuropeNorwayOceaniaPakistanPanamaPeruPhilippinesPolandPortugalRomaniaRussiaSaudi ArabiaScotlandSenegalSerbiaSierra LeoneSingaporeSomaliaSouth AfricaSouth AmericaSouth Central AsiaSouth Eastern AsiaSouthern EuropeSpainSri LankaSt. Vincent and the GrenadinesSudanSwedenSwitzerlandSyriaTaiwanThailandTrinidad and TobagoTurkeyUgandaUkraineUruguayUzbekistanVenezuelaVietnamWest IndiesWestern AfricaWestern AsiaWestern EuropeYemenZaireZimbabweAzores
3rd Grade
Income
Poverty
Unemployment
Labor Participation
Family Structure
Vehicle Availability
Education Level
Disability

3rd Grade Comparison

Pima

Immigrants

Exceptional
Tragic
98.0%
3RD GRADE
96.7/ 100
METRIC RATING
109th/ 347
METRIC RANK
96.9%
3RD GRADE
0.0/ 100
METRIC RATING
296th/ 347
METRIC RANK

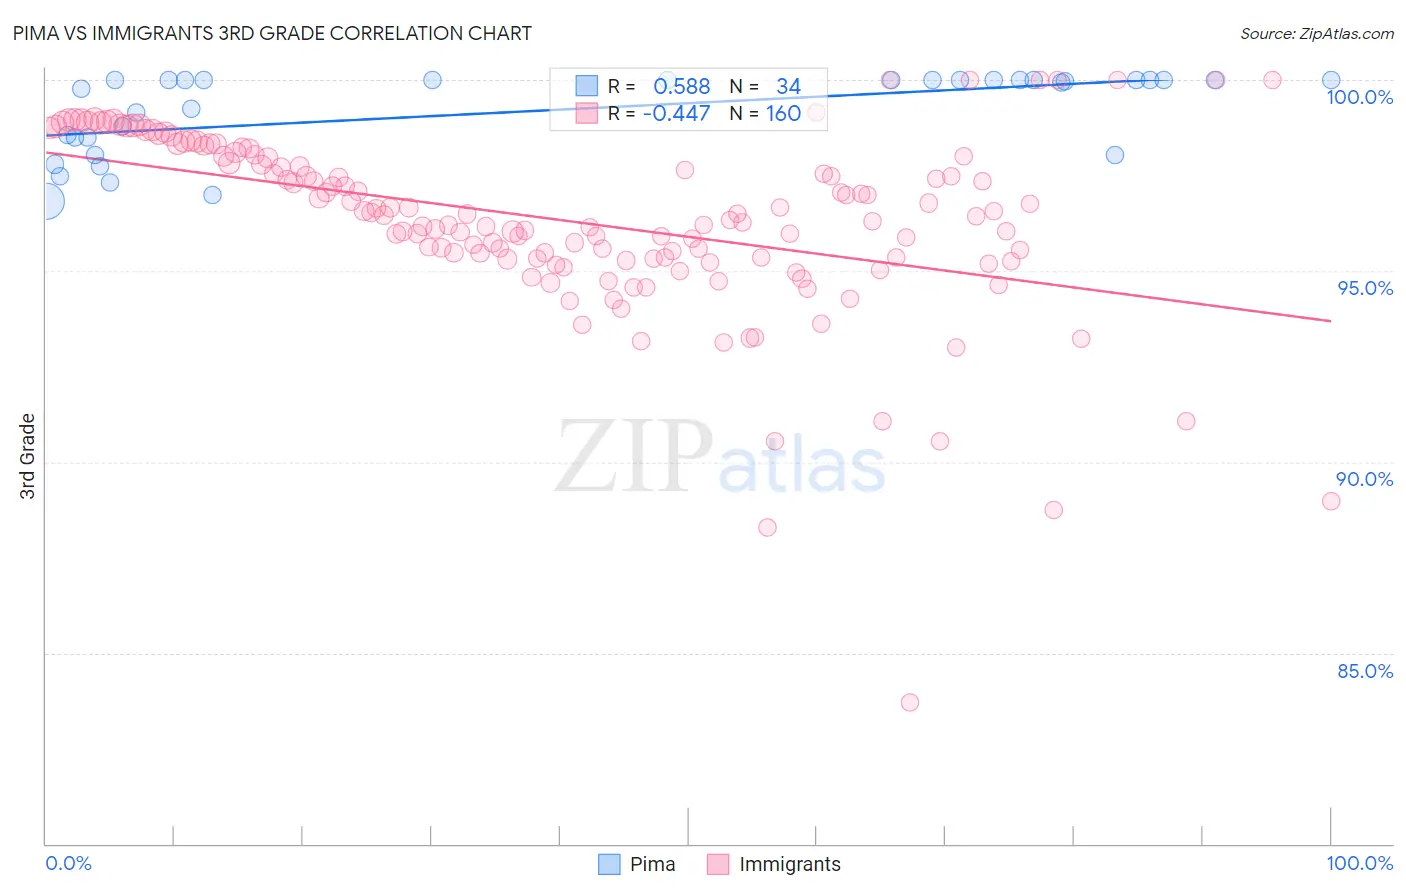
Pima vs Immigrants 3rd Grade Correlation Chart

The statistical analysis conducted on geographies consisting of 61,552,942 people shows a substantial positive correlation between the proportion of Pima and percentage of population with at least 3rd grade education in the United States with a correlation coefficient (R) of 0.588 and weighted average of 98.0%. Similarly, the statistical analysis conducted on geographies consisting of 577,788,049 people shows a moderate negative correlation between the proportion of Immigrants and percentage of population with at least 3rd grade education in the United States with a correlation coefficient (R) of -0.447 and weighted average of 96.9%, a difference of 1.2%.
Pima vs Immigrants 3rd Grade

3rd Grade Correlation Summary

MeasurementPimaImmigrants
Minimum96.8%83.7%
Maximum100.0%100.0%
Range3.2%16.3%
Mean99.2%96.3%
Median100.0%96.4%
Interquartile 25% (IQ1)98.5%95.3%
Interquartile 75% (IQ3)100.0%98.0%
Interquartile Range (IQR)1.5%2.7%
Standard Deviation (Sample)1.1%2.4%
Standard Deviation (Population)1.1%2.4%

Similar Demographics by 3rd Grade

Demographics Similar to Pima by 3rd Grade

In terms of 3rd grade, the demographic groups most similar to Pima are Immigrants from Singapore (98.0%, a difference of 0.0%), Immigrants from Switzerland (98.0%, a difference of 0.0%), German Russian (98.1%, a difference of 0.010%), Bhutanese (98.1%, a difference of 0.010%), and Immigrants from Czechoslovakia (98.0%, a difference of 0.010%).
DemographicsRating | Rank3rd Grade
Immigrants | Nonimmigrants
97.8
/100
|
#102
Exceptional
98.1%
Yugoslavians
97.7
/100
|
#103
Exceptional
98.1%
Turks
97.6
/100
|
#104
Exceptional
98.1%
German Russians
97.2
/100
|
#105
Exceptional
98.1%
Bhutanese
97.2
/100
|
#106
Exceptional
98.1%
Immigrants | Czechoslovakia
97.0
/100
|
#107
Exceptional
98.0%
Immigrants | Singapore
96.7
/100
|
#108
Exceptional
98.0%
Pima
96.7
/100
|
#109
Exceptional
98.0%
Immigrants | Switzerland
96.6
/100
|
#110
Exceptional
98.0%
Basques
96.5
/100
|
#111
Exceptional
98.0%
Immigrants | Latvia
96.0
/100
|
#112
Exceptional
98.0%
Thais
95.5
/100
|
#113
Exceptional
98.0%
Menominee
95.4
/100
|
#114
Exceptional
98.0%
Okinawans
95.2
/100
|
#115
Exceptional
98.0%
Immigrants | Norway
95.2
/100
|
#116
Exceptional
98.0%

Demographics Similar to Immigrants by 3rd Grade

In terms of 3rd grade, the demographic groups most similar to Immigrants are Haitian (96.9%, a difference of 0.020%), Immigrants from Dominica (96.9%, a difference of 0.030%), Somali (96.8%, a difference of 0.040%), Immigrants from South Eastern Asia (96.8%, a difference of 0.050%), and Immigrants from Cuba (96.8%, a difference of 0.050%).
DemographicsRating | Rank3rd Grade
Immigrants | Thailand
0.0
/100
|
#289
Tragic
97.1%
Immigrants | Portugal
0.0
/100
|
#290
Tragic
97.0%
Immigrants | Afghanistan
0.0
/100
|
#291
Tragic
97.0%
British West Indians
0.0
/100
|
#292
Tragic
97.0%
Immigrants | Grenada
0.0
/100
|
#293
Tragic
97.0%
Malaysians
0.0
/100
|
#294
Tragic
97.0%
Immigrants | Eritrea
0.0
/100
|
#295
Tragic
97.0%
Immigrants | Immigrants
0.0
/100
|
#296
Tragic
96.9%
Haitians
0.0
/100
|
#297
Tragic
96.9%
Immigrants | Dominica
0.0
/100
|
#298
Tragic
96.9%
Somalis
0.0
/100
|
#299
Tragic
96.8%
Immigrants | South Eastern Asia
0.0
/100
|
#300
Tragic
96.8%
Immigrants | Cuba
0.0
/100
|
#301
Tragic
96.8%
Immigrants | Somalia
0.0
/100
|
#302
Tragic
96.8%
Ecuadorians
0.0
/100
|
#303
Tragic
96.7%