Peruvian vs Uruguayan 12th Grade, No Diploma
COMPARE
Peruvian
Uruguayan
12th Grade, No Diploma
12th Grade, No Diploma Comparison
Peruvians
Uruguayans
90.2%
12TH GRADE, NO DIPLOMA
2.7/ 100
METRIC RATING
231st/ 347
METRIC RANK
90.4%
12TH GRADE, NO DIPLOMA
7.0/ 100
METRIC RATING
219th/ 347
METRIC RANK
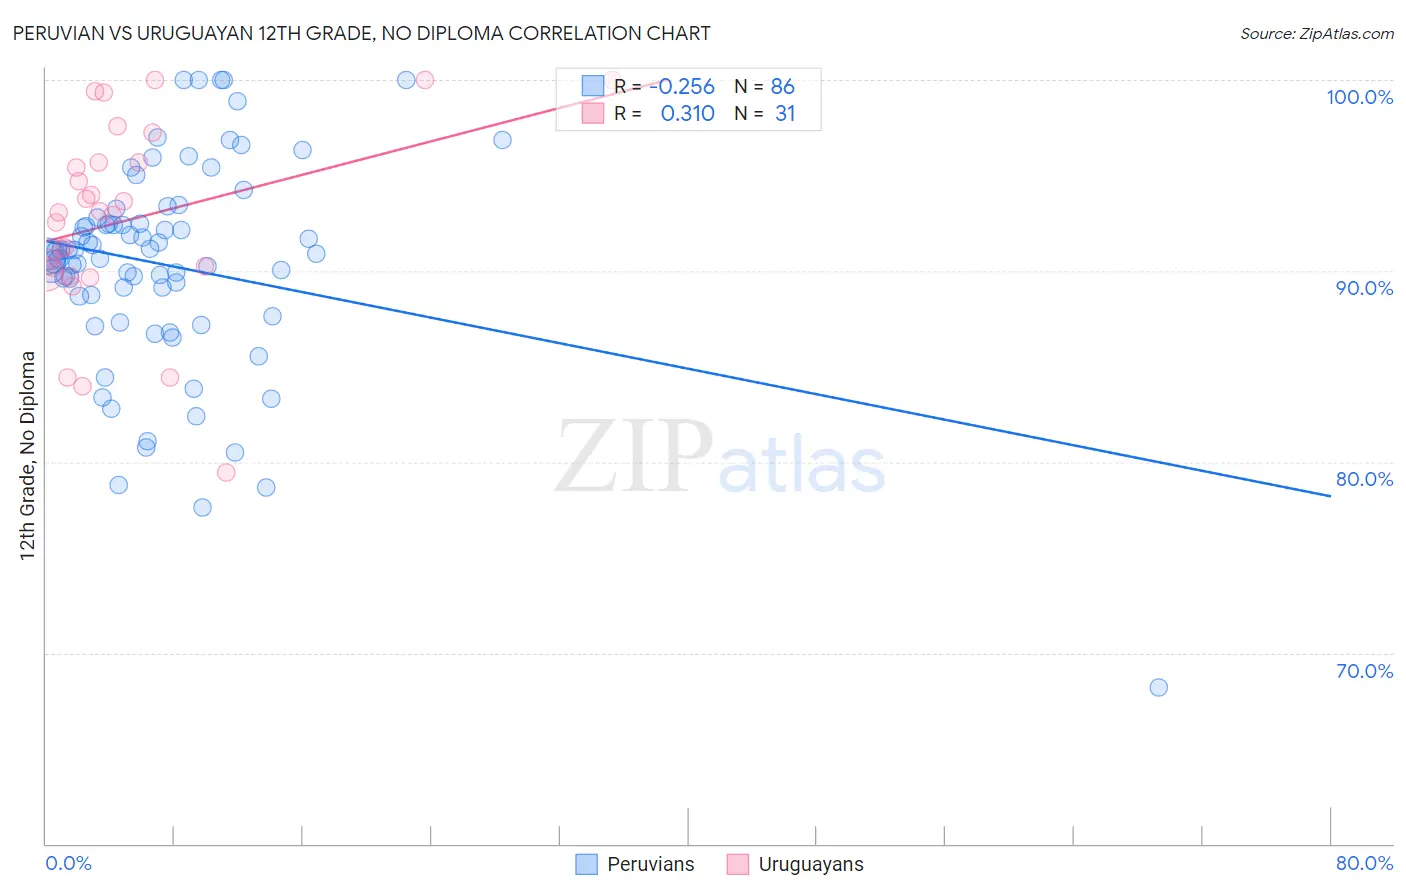
Peruvian vs Uruguayan 12th Grade, No Diploma Correlation Chart
The statistical analysis conducted on geographies consisting of 363,251,075 people shows a weak negative correlation between the proportion of Peruvians and percentage of population with at least 12th grade (no diploma) education in the United States with a correlation coefficient (R) of -0.256 and weighted average of 90.2%. Similarly, the statistical analysis conducted on geographies consisting of 144,782,615 people shows a mild positive correlation between the proportion of Uruguayans and percentage of population with at least 12th grade (no diploma) education in the United States with a correlation coefficient (R) of 0.310 and weighted average of 90.4%, a difference of 0.32%.
12th Grade, No Diploma Correlation Summary
| Measurement | Peruvian | Uruguayan |
| Minimum | 68.2% | 79.4% |
| Maximum | 100.0% | 100.0% |
| Range | 31.8% | 20.6% |
| Mean | 90.3% | 92.7% |
| Median | 90.9% | 93.1% |
| Interquartile 25% (IQ1) | 88.7% | 89.9% |
| Interquartile 75% (IQ3) | 92.5% | 95.7% |
| Interquartile Range (IQR) | 3.8% | 5.8% |
| Standard Deviation (Sample) | 5.5% | 5.1% |
| Standard Deviation (Population) | 5.5% | 5.0% |
Demographics Similar to Peruvians and Uruguayans by 12th Grade, No Diploma
In terms of 12th grade, no diploma, the demographic groups most similar to Peruvians are Immigrants from Philippines (90.2%, a difference of 0.010%), Blackfeet (90.1%, a difference of 0.030%), Immigrants from Thailand (90.1%, a difference of 0.050%), Immigrants from South America (90.1%, a difference of 0.050%), and Colville (90.1%, a difference of 0.050%). Similarly, the demographic groups most similar to Uruguayans are Shoshone (90.5%, a difference of 0.020%), Cherokee (90.5%, a difference of 0.020%), Immigrants from Cameroon (90.5%, a difference of 0.020%), Colombian (90.4%, a difference of 0.020%), and Arapaho (90.5%, a difference of 0.030%).
| Demographics | Rating | Rank | 12th Grade, No Diploma |
| Arapaho | 7.7 /100 | #215 | Tragic 90.5% |
| Shoshone | 7.5 /100 | #216 | Tragic 90.5% |
| Cherokee | 7.4 /100 | #217 | Tragic 90.5% |
| Immigrants | Cameroon | 7.4 /100 | #218 | Tragic 90.5% |
| Uruguayans | 7.0 /100 | #219 | Tragic 90.4% |
| Colombians | 6.6 /100 | #220 | Tragic 90.4% |
| Immigrants | Liberia | 5.7 /100 | #221 | Tragic 90.4% |
| Immigrants | Somalia | 5.3 /100 | #222 | Tragic 90.4% |
| South Americans | 5.0 /100 | #223 | Tragic 90.3% |
| Immigrants | Panama | 4.8 /100 | #224 | Tragic 90.3% |
| Chickasaw | 4.8 /100 | #225 | Tragic 90.3% |
| Immigrants | Zaire | 4.6 /100 | #226 | Tragic 90.3% |
| Nigerians | 4.5 /100 | #227 | Tragic 90.3% |
| Creek | 3.9 /100 | #228 | Tragic 90.3% |
| Immigrants | Bahamas | 3.6 /100 | #229 | Tragic 90.2% |
| Immigrants | Philippines | 2.8 /100 | #230 | Tragic 90.2% |
| Peruvians | 2.7 /100 | #231 | Tragic 90.2% |
| Blackfeet | 2.4 /100 | #232 | Tragic 90.1% |
| Immigrants | Thailand | 2.3 /100 | #233 | Tragic 90.1% |
| Immigrants | South America | 2.3 /100 | #234 | Tragic 90.1% |
| Colville | 2.3 /100 | #235 | Tragic 90.1% |