Panamanian vs Immigrants from Turkey Doctorate Degree
COMPARE
Panamanian
Immigrants from Turkey
Doctorate Degree
Doctorate Degree Comparison
Panamanians
Immigrants from Turkey
1.7%
DOCTORATE DEGREE
6.3/ 100
METRIC RATING
227th/ 347
METRIC RANK
2.6%
DOCTORATE DEGREE
100.0/ 100
METRIC RATING
27th/ 347
METRIC RANK
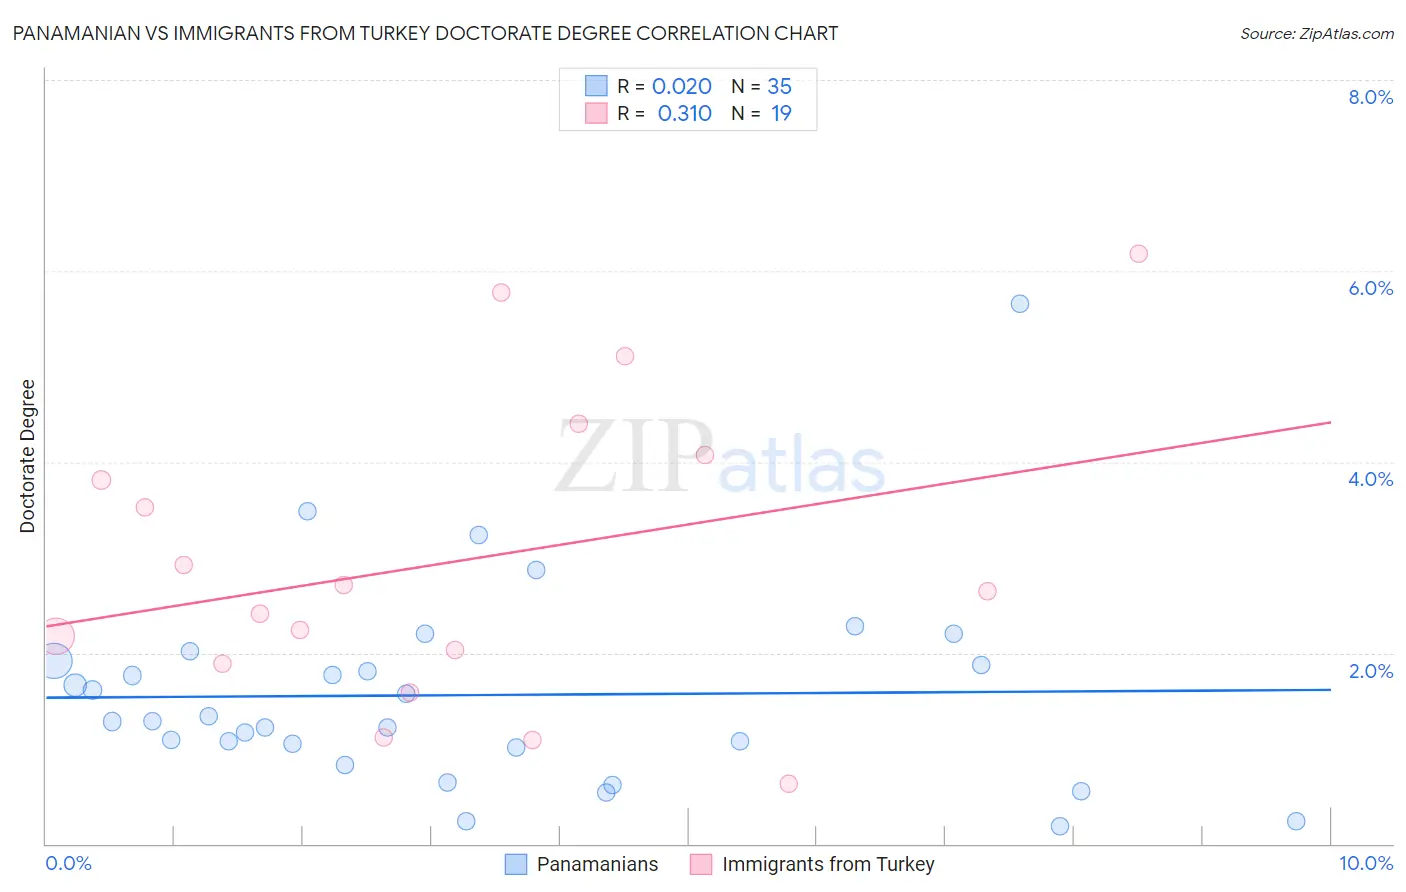
Panamanian vs Immigrants from Turkey Doctorate Degree Correlation Chart
The statistical analysis conducted on geographies consisting of 279,501,453 people shows no correlation between the proportion of Panamanians and percentage of population with at least doctorate degree education in the United States with a correlation coefficient (R) of 0.020 and weighted average of 1.7%. Similarly, the statistical analysis conducted on geographies consisting of 222,587,389 people shows a mild positive correlation between the proportion of Immigrants from Turkey and percentage of population with at least doctorate degree education in the United States with a correlation coefficient (R) of 0.310 and weighted average of 2.6%, a difference of 59.6%.
Doctorate Degree Correlation Summary
| Measurement | Panamanian | Immigrants from Turkey |
| Minimum | 0.18% | 0.63% |
| Maximum | 5.7% | 6.2% |
| Range | 5.5% | 5.6% |
| Mean | 1.6% | 3.0% |
| Median | 1.3% | 2.6% |
| Interquartile 25% (IQ1) | 1.0% | 1.9% |
| Interquartile 75% (IQ3) | 1.9% | 4.1% |
| Interquartile Range (IQR) | 0.91% | 2.2% |
| Standard Deviation (Sample) | 1.1% | 1.6% |
| Standard Deviation (Population) | 1.0% | 1.5% |
Similar Demographics by Doctorate Degree
Demographics Similar to Panamanians by Doctorate Degree
In terms of doctorate degree, the demographic groups most similar to Panamanians are Osage (1.7%, a difference of 0.14%), Immigrants from Colombia (1.7%, a difference of 0.26%), Assyrian/Chaldean/Syriac (1.7%, a difference of 0.28%), Immigrants from Poland (1.7%, a difference of 0.75%), and Immigrants from Bosnia and Herzegovina (1.7%, a difference of 0.97%).
| Demographics | Rating | Rank | Doctorate Degree |
| Immigrants | Uruguay | 9.2 /100 | #220 | Tragic 1.7% |
| Immigrants | Nonimmigrants | 8.8 /100 | #221 | Tragic 1.7% |
| Immigrants | Venezuela | 8.7 /100 | #222 | Tragic 1.7% |
| Immigrants | Bosnia and Herzegovina | 7.8 /100 | #223 | Tragic 1.7% |
| Immigrants | Poland | 7.4 /100 | #224 | Tragic 1.7% |
| Immigrants | Colombia | 6.7 /100 | #225 | Tragic 1.7% |
| Osage | 6.5 /100 | #226 | Tragic 1.7% |
| Panamanians | 6.3 /100 | #227 | Tragic 1.7% |
| Assyrians/Chaldeans/Syriacs | 5.9 /100 | #228 | Tragic 1.7% |
| Colville | 4.7 /100 | #229 | Tragic 1.6% |
| Immigrants | Philippines | 4.3 /100 | #230 | Tragic 1.6% |
| Immigrants | North Macedonia | 3.9 /100 | #231 | Tragic 1.6% |
| Guamanians/Chamorros | 3.3 /100 | #232 | Tragic 1.6% |
| Barbadians | 3.3 /100 | #233 | Tragic 1.6% |
| Hopi | 3.2 /100 | #234 | Tragic 1.6% |
Demographics Similar to Immigrants from Turkey by Doctorate Degree
In terms of doctorate degree, the demographic groups most similar to Immigrants from Turkey are Burmese (2.6%, a difference of 0.30%), Immigrants from South Central Asia (2.6%, a difference of 0.57%), Immigrants from Korea (2.6%, a difference of 0.61%), Turkish (2.7%, a difference of 0.87%), and Immigrants from Saudi Arabia (2.7%, a difference of 1.4%).
| Demographics | Rating | Rank | Doctorate Degree |
| Immigrants | Hong Kong | 100.0 /100 | #20 | Exceptional 2.8% |
| Thais | 100.0 /100 | #21 | Exceptional 2.8% |
| Mongolians | 100.0 /100 | #22 | Exceptional 2.8% |
| Immigrants | Denmark | 100.0 /100 | #23 | Exceptional 2.8% |
| Israelis | 100.0 /100 | #24 | Exceptional 2.7% |
| Immigrants | Saudi Arabia | 100.0 /100 | #25 | Exceptional 2.7% |
| Turks | 100.0 /100 | #26 | Exceptional 2.7% |
| Immigrants | Turkey | 100.0 /100 | #27 | Exceptional 2.6% |
| Burmese | 100.0 /100 | #28 | Exceptional 2.6% |
| Immigrants | South Central Asia | 100.0 /100 | #29 | Exceptional 2.6% |
| Immigrants | Korea | 100.0 /100 | #30 | Exceptional 2.6% |
| Latvians | 100.0 /100 | #31 | Exceptional 2.6% |
| Immigrants | Northern Europe | 100.0 /100 | #32 | Exceptional 2.6% |
| Cambodians | 100.0 /100 | #33 | Exceptional 2.6% |
| Cypriots | 100.0 /100 | #34 | Exceptional 2.6% |