Panamanian vs Immigrants from Sweden 11th Grade
COMPARE
Panamanian
Immigrants from Sweden
11th Grade
11th Grade Comparison
Panamanians
Immigrants from Sweden
92.3%
11TH GRADE
26.4/ 100
METRIC RATING
196th/ 347
METRIC RANK
93.9%
11TH GRADE
99.8/ 100
METRIC RATING
64th/ 347
METRIC RANK
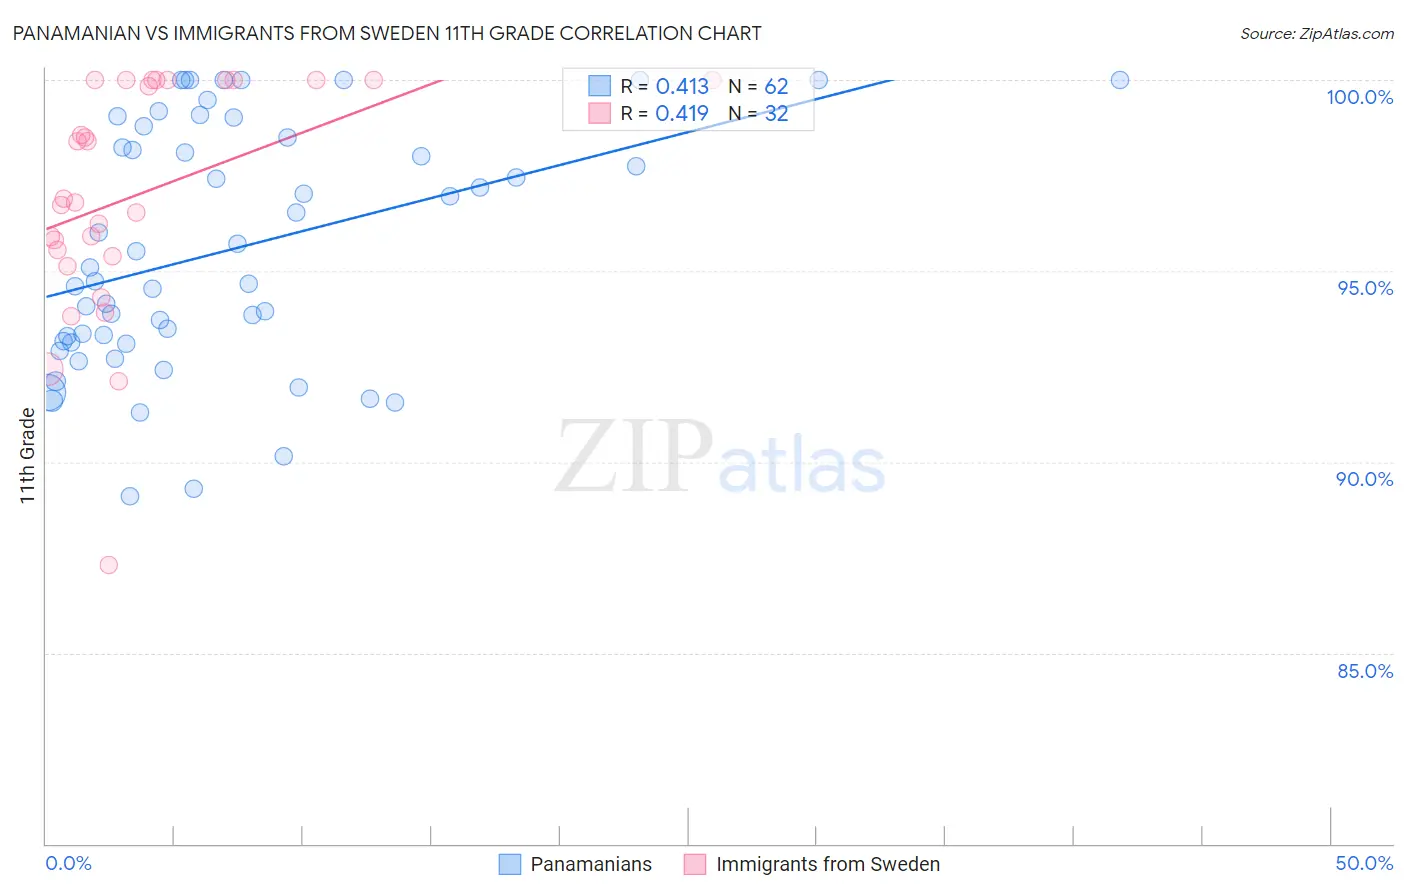
Panamanian vs Immigrants from Sweden 11th Grade Correlation Chart
The statistical analysis conducted on geographies consisting of 281,248,945 people shows a moderate positive correlation between the proportion of Panamanians and percentage of population with at least 11th grade education in the United States with a correlation coefficient (R) of 0.413 and weighted average of 92.3%. Similarly, the statistical analysis conducted on geographies consisting of 164,736,894 people shows a moderate positive correlation between the proportion of Immigrants from Sweden and percentage of population with at least 11th grade education in the United States with a correlation coefficient (R) of 0.419 and weighted average of 93.9%, a difference of 1.8%.
11th Grade Correlation Summary
| Measurement | Panamanian | Immigrants from Sweden |
| Minimum | 89.1% | 87.3% |
| Maximum | 100.0% | 100.0% |
| Range | 10.9% | 12.7% |
| Mean | 95.6% | 97.0% |
| Median | 94.9% | 96.8% |
| Interquartile 25% (IQ1) | 93.1% | 95.5% |
| Interquartile 75% (IQ3) | 98.5% | 100.0% |
| Interquartile Range (IQR) | 5.4% | 4.5% |
| Standard Deviation (Sample) | 3.2% | 3.0% |
| Standard Deviation (Population) | 3.1% | 3.0% |
Similar Demographics by 11th Grade
Demographics Similar to Panamanians by 11th Grade
In terms of 11th grade, the demographic groups most similar to Panamanians are Liberian (92.3%, a difference of 0.010%), Marshallese (92.3%, a difference of 0.010%), Hawaiian (92.3%, a difference of 0.010%), Immigrants from Uganda (92.3%, a difference of 0.020%), and Samoan (92.3%, a difference of 0.020%).
| Demographics | Rating | Rank | 11th Grade |
| Immigrants | Chile | 33.3 /100 | #189 | Fair 92.4% |
| Chickasaw | 31.4 /100 | #190 | Fair 92.3% |
| French American Indians | 30.8 /100 | #191 | Fair 92.3% |
| Immigrants | Syria | 30.4 /100 | #192 | Fair 92.3% |
| Moroccans | 28.7 /100 | #193 | Fair 92.3% |
| Sioux | 28.5 /100 | #194 | Fair 92.3% |
| Liberians | 26.8 /100 | #195 | Fair 92.3% |
| Panamanians | 26.4 /100 | #196 | Fair 92.3% |
| Marshallese | 26.0 /100 | #197 | Fair 92.3% |
| Hawaiians | 25.5 /100 | #198 | Fair 92.3% |
| Immigrants | Uganda | 25.2 /100 | #199 | Fair 92.3% |
| Samoans | 25.1 /100 | #200 | Fair 92.3% |
| Immigrants | China | 25.1 /100 | #201 | Fair 92.3% |
| Immigrants | Eastern Africa | 24.1 /100 | #202 | Fair 92.3% |
| Immigrants | Sudan | 23.5 /100 | #203 | Fair 92.3% |
Demographics Similar to Immigrants from Sweden by 11th Grade
In terms of 11th grade, the demographic groups most similar to Immigrants from Sweden are Native Hawaiian (93.9%, a difference of 0.0%), Alaskan Athabascan (93.9%, a difference of 0.020%), Immigrants from Netherlands (93.9%, a difference of 0.020%), Ukrainian (94.0%, a difference of 0.030%), and Zimbabwean (93.9%, a difference of 0.040%).
| Demographics | Rating | Rank | 11th Grade |
| New Zealanders | 99.9 /100 | #57 | Exceptional 94.0% |
| Iranians | 99.9 /100 | #58 | Exceptional 94.0% |
| Bhutanese | 99.8 /100 | #59 | Exceptional 94.0% |
| Okinawans | 99.8 /100 | #60 | Exceptional 94.0% |
| Immigrants | Belgium | 99.8 /100 | #61 | Exceptional 94.0% |
| Austrians | 99.8 /100 | #62 | Exceptional 94.0% |
| Ukrainians | 99.8 /100 | #63 | Exceptional 94.0% |
| Immigrants | Sweden | 99.8 /100 | #64 | Exceptional 93.9% |
| Native Hawaiians | 99.8 /100 | #65 | Exceptional 93.9% |
| Alaskan Athabascans | 99.8 /100 | #66 | Exceptional 93.9% |
| Immigrants | Netherlands | 99.8 /100 | #67 | Exceptional 93.9% |
| Zimbabweans | 99.8 /100 | #68 | Exceptional 93.9% |
| Scotch-Irish | 99.8 /100 | #69 | Exceptional 93.9% |
| Immigrants | England | 99.7 /100 | #70 | Exceptional 93.8% |
| Immigrants | South Africa | 99.7 /100 | #71 | Exceptional 93.8% |