Panamanian vs Immigrants from Korea Kindergarten
COMPARE
Panamanian
Immigrants from Korea
Kindergarten
Kindergarten Comparison
Panamanians
Immigrants from Korea
97.9%
KINDERGARTEN
33.3/ 100
METRIC RATING
190th/ 347
METRIC RANK
98.0%
KINDERGARTEN
54.1/ 100
METRIC RATING
169th/ 347
METRIC RANK
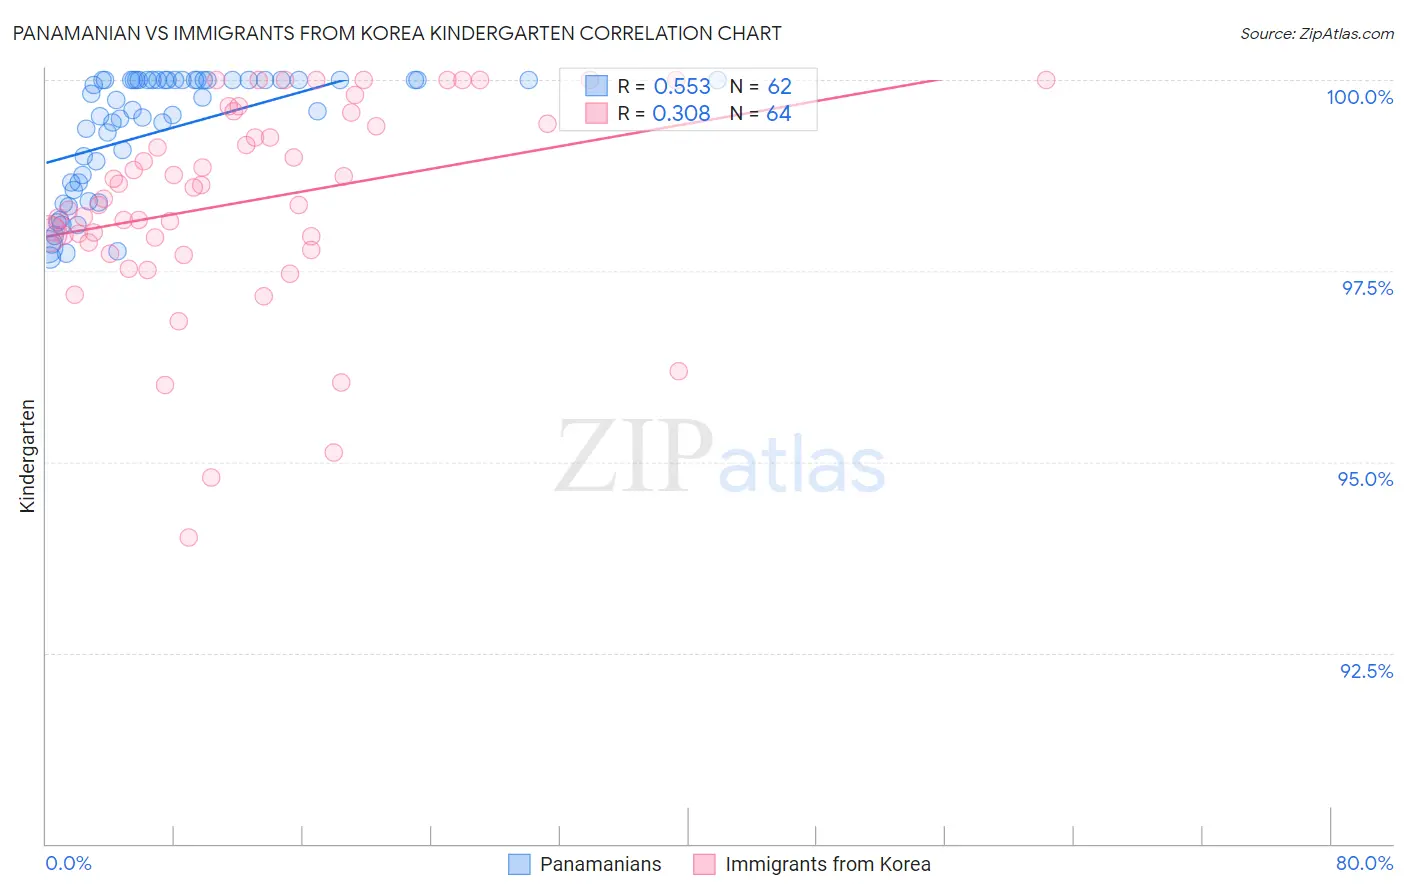
Panamanian vs Immigrants from Korea Kindergarten Correlation Chart
The statistical analysis conducted on geographies consisting of 281,248,945 people shows a substantial positive correlation between the proportion of Panamanians and percentage of population with at least kindergarten education in the United States with a correlation coefficient (R) of 0.553 and weighted average of 97.9%. Similarly, the statistical analysis conducted on geographies consisting of 416,280,076 people shows a mild positive correlation between the proportion of Immigrants from Korea and percentage of population with at least kindergarten education in the United States with a correlation coefficient (R) of 0.308 and weighted average of 98.0%, a difference of 0.070%.
Kindergarten Correlation Summary
| Measurement | Panamanian | Immigrants from Korea |
| Minimum | 97.7% | 94.0% |
| Maximum | 100.0% | 100.0% |
| Range | 2.3% | 6.0% |
| Mean | 99.3% | 98.4% |
| Median | 99.7% | 98.5% |
| Interquartile 25% (IQ1) | 98.7% | 97.9% |
| Interquartile 75% (IQ3) | 100.0% | 99.5% |
| Interquartile Range (IQR) | 1.3% | 1.6% |
| Standard Deviation (Sample) | 0.80% | 1.3% |
| Standard Deviation (Population) | 0.79% | 1.3% |
Similar Demographics by Kindergarten
Demographics Similar to Panamanians by Kindergarten
In terms of kindergarten, the demographic groups most similar to Panamanians are Paiute (97.9%, a difference of 0.0%), Pakistani (97.9%, a difference of 0.010%), Immigrants from Kazakhstan (97.9%, a difference of 0.010%), Arab (97.9%, a difference of 0.010%), and Immigrants from Taiwan (97.9%, a difference of 0.010%).
| Demographics | Rating | Rank | Kindergarten |
| Immigrants | Poland | 41.4 /100 | #183 | Average 97.9% |
| Immigrants | Argentina | 40.7 /100 | #184 | Average 97.9% |
| Immigrants | Belarus | 39.4 /100 | #185 | Fair 97.9% |
| Pakistanis | 36.0 /100 | #186 | Fair 97.9% |
| Immigrants | Kazakhstan | 35.9 /100 | #187 | Fair 97.9% |
| Arabs | 35.4 /100 | #188 | Fair 97.9% |
| Paiute | 34.7 /100 | #189 | Fair 97.9% |
| Panamanians | 33.3 /100 | #190 | Fair 97.9% |
| Immigrants | Taiwan | 30.7 /100 | #191 | Fair 97.9% |
| Blacks/African Americans | 29.9 /100 | #192 | Fair 97.9% |
| Paraguayans | 29.6 /100 | #193 | Fair 97.9% |
| Hawaiians | 29.3 /100 | #194 | Fair 97.9% |
| Mongolians | 28.9 /100 | #195 | Fair 97.9% |
| Guamanians/Chamorros | 26.2 /100 | #196 | Fair 97.9% |
| Immigrants | Kenya | 25.5 /100 | #197 | Fair 97.9% |
Demographics Similar to Immigrants from Korea by Kindergarten
In terms of kindergarten, the demographic groups most similar to Immigrants from Korea are Immigrants from Spain (98.0%, a difference of 0.0%), Navajo (98.0%, a difference of 0.0%), Bermudan (98.0%, a difference of 0.0%), Immigrants from Jordan (98.0%, a difference of 0.0%), and Spanish American (98.0%, a difference of 0.010%).
| Demographics | Rating | Rank | Kindergarten |
| Immigrants | Italy | 58.9 /100 | #162 | Average 98.0% |
| Spanish Americans | 57.8 /100 | #163 | Average 98.0% |
| Immigrants | Micronesia | 57.7 /100 | #164 | Average 98.0% |
| Ugandans | 56.9 /100 | #165 | Average 98.0% |
| Chileans | 56.3 /100 | #166 | Average 98.0% |
| Immigrants | Spain | 54.6 /100 | #167 | Average 98.0% |
| Navajo | 54.4 /100 | #168 | Average 98.0% |
| Immigrants | Korea | 54.1 /100 | #169 | Average 98.0% |
| Bermudans | 54.0 /100 | #170 | Average 98.0% |
| Immigrants | Jordan | 54.0 /100 | #171 | Average 98.0% |
| Natives/Alaskans | 51.0 /100 | #172 | Average 98.0% |
| Kenyans | 51.0 /100 | #173 | Average 98.0% |
| Immigrants | Brazil | 50.0 /100 | #174 | Average 98.0% |
| Immigrants | Sri Lanka | 49.6 /100 | #175 | Average 97.9% |
| Albanians | 48.5 /100 | #176 | Average 97.9% |