Panamanian vs Immigrants from Cuba Professional Degree
COMPARE
Panamanian
Immigrants from Cuba
Professional Degree
Professional Degree Comparison
Panamanians
Immigrants from Cuba
4.1%
PROFESSIONAL DEGREE
15.9/ 100
METRIC RATING
203rd/ 347
METRIC RANK
3.6%
PROFESSIONAL DEGREE
0.6/ 100
METRIC RATING
269th/ 347
METRIC RANK
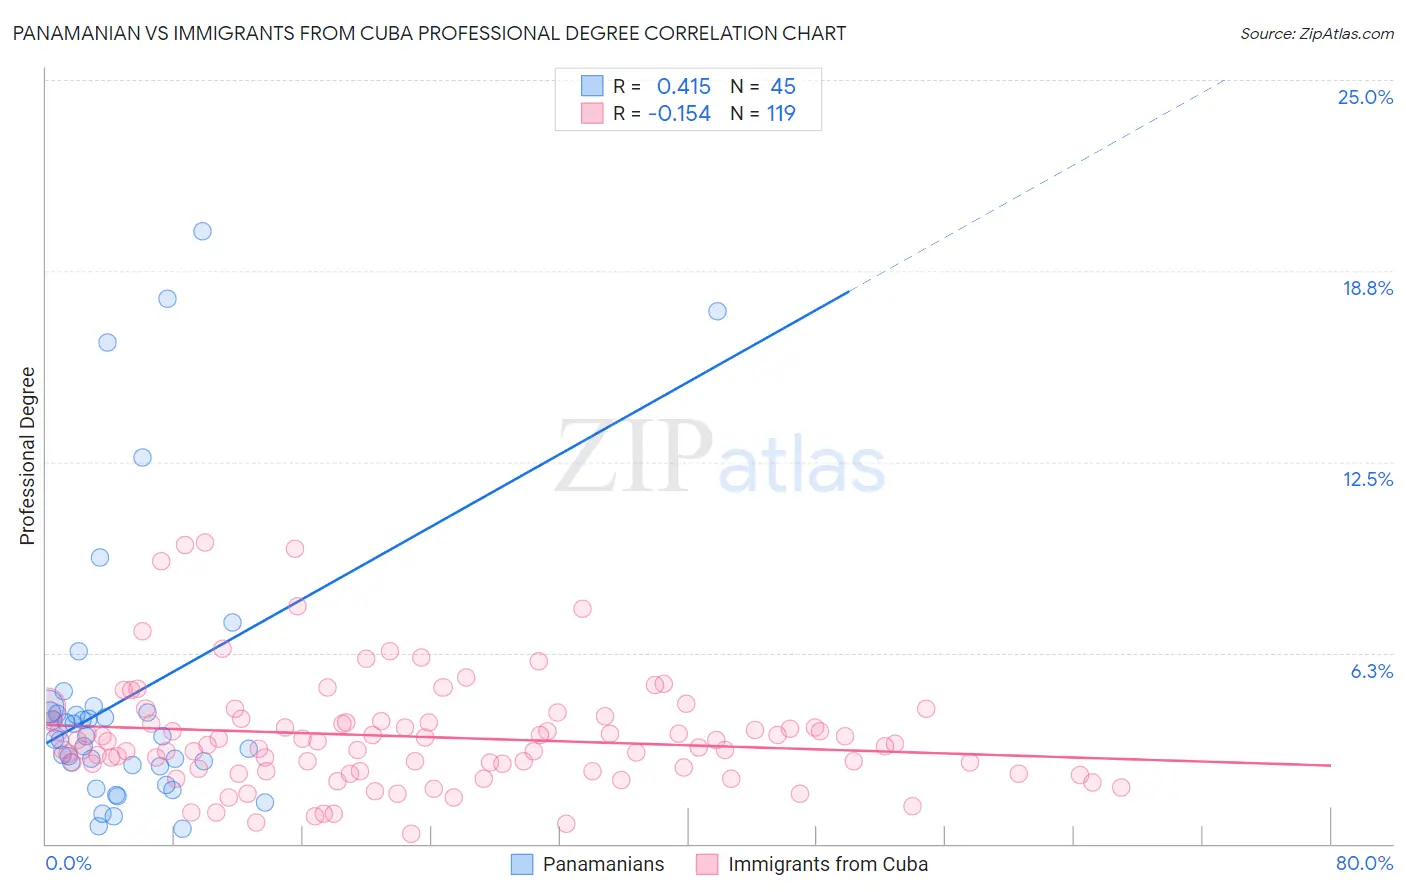
Panamanian vs Immigrants from Cuba Professional Degree Correlation Chart
The statistical analysis conducted on geographies consisting of 280,833,474 people shows a moderate positive correlation between the proportion of Panamanians and percentage of population with at least professional degree education in the United States with a correlation coefficient (R) of 0.415 and weighted average of 4.1%. Similarly, the statistical analysis conducted on geographies consisting of 325,367,242 people shows a poor negative correlation between the proportion of Immigrants from Cuba and percentage of population with at least professional degree education in the United States with a correlation coefficient (R) of -0.154 and weighted average of 3.6%, a difference of 15.1%.
Professional Degree Correlation Summary
| Measurement | Panamanian | Immigrants from Cuba |
| Minimum | 0.49% | 0.31% |
| Maximum | 20.0% | 9.9% |
| Range | 19.6% | 9.6% |
| Mean | 4.8% | 3.5% |
| Median | 3.5% | 3.2% |
| Interquartile 25% (IQ1) | 2.6% | 2.4% |
| Interquartile 75% (IQ3) | 4.4% | 4.0% |
| Interquartile Range (IQR) | 1.8% | 1.6% |
| Standard Deviation (Sample) | 4.7% | 1.8% |
| Standard Deviation (Population) | 4.6% | 1.8% |
Similar Demographics by Professional Degree
Demographics Similar to Panamanians by Professional Degree
In terms of professional degree, the demographic groups most similar to Panamanians are Barbadian (4.1%, a difference of 0.030%), Immigrants from Iraq (4.2%, a difference of 0.33%), Somali (4.1%, a difference of 0.35%), Finnish (4.2%, a difference of 0.76%), and Yugoslavian (4.1%, a difference of 0.78%).
| Demographics | Rating | Rank | Professional Degree |
| Spanish | 23.0 /100 | #196 | Fair 4.2% |
| Czechoslovakians | 22.4 /100 | #197 | Fair 4.2% |
| Immigrants | Middle Africa | 22.1 /100 | #198 | Fair 4.2% |
| Norwegians | 20.5 /100 | #199 | Fair 4.2% |
| Immigrants | North Macedonia | 20.2 /100 | #200 | Fair 4.2% |
| Finns | 18.7 /100 | #201 | Poor 4.2% |
| Immigrants | Iraq | 17.1 /100 | #202 | Poor 4.2% |
| Panamanians | 15.9 /100 | #203 | Poor 4.1% |
| Barbadians | 15.8 /100 | #204 | Poor 4.1% |
| Somalis | 14.8 /100 | #205 | Poor 4.1% |
| Yugoslavians | 13.4 /100 | #206 | Poor 4.1% |
| Sub-Saharan Africans | 12.8 /100 | #207 | Poor 4.1% |
| Immigrants | Somalia | 12.5 /100 | #208 | Poor 4.1% |
| Immigrants | Panama | 12.3 /100 | #209 | Poor 4.1% |
| Immigrants | Nigeria | 11.7 /100 | #210 | Poor 4.1% |
Demographics Similar to Immigrants from Cuba by Professional Degree
In terms of professional degree, the demographic groups most similar to Immigrants from Cuba are Central American (3.6%, a difference of 0.29%), Aleut (3.6%, a difference of 0.60%), Delaware (3.6%, a difference of 0.75%), Belizean (3.6%, a difference of 0.76%), and Immigrants from Jamaica (3.6%, a difference of 0.78%).
| Demographics | Rating | Rank | Professional Degree |
| U.S. Virgin Islanders | 1.0 /100 | #262 | Tragic 3.7% |
| Hopi | 0.9 /100 | #263 | Tragic 3.6% |
| Immigrants | Cambodia | 0.9 /100 | #264 | Tragic 3.6% |
| Immigrants | Congo | 0.8 /100 | #265 | Tragic 3.6% |
| Central American Indians | 0.8 /100 | #266 | Tragic 3.6% |
| Delaware | 0.7 /100 | #267 | Tragic 3.6% |
| Aleuts | 0.7 /100 | #268 | Tragic 3.6% |
| Immigrants | Cuba | 0.6 /100 | #269 | Tragic 3.6% |
| Central Americans | 0.6 /100 | #270 | Tragic 3.6% |
| Belizeans | 0.5 /100 | #271 | Tragic 3.6% |
| Immigrants | Jamaica | 0.5 /100 | #272 | Tragic 3.6% |
| Americans | 0.5 /100 | #273 | Tragic 3.6% |
| Potawatomi | 0.5 /100 | #274 | Tragic 3.6% |
| Immigrants | Dominica | 0.5 /100 | #275 | Tragic 3.6% |
| Liberians | 0.5 /100 | #276 | Tragic 3.6% |