Palestinian vs Immigrants from Zaire 11th Grade

COMPARE

Palestinian
Race
Ancestry
AfghanAfricanAlaska NativeAlaskan AthabascanAlbanianAleutAlsatianAmericanApacheArabArapahoArgentineanArmenianAssyrian/Chaldean/SyriacAustralianAustrianBahamianBangladeshiBarbadianBasqueBelgianBelizeanBermudanBhutaneseBlackfeetBolivianBrazilianBritishBritish West IndianBulgarianBurmeseCajunCambodianCanadianCape VerdeanCarpatho RusynCelticCentral AmericanCentral American IndianCherokeeCheyenneChickasawChileanChineseChippewaChoctawColombianColvilleComancheCosta RicanCreeCreekCroatianCrowCubanCypriotCzechCzechoslovakianDanishDelawareDominicanDutchDutch West IndianEastern EuropeanEcuadorianEgyptianEnglishEstonianEthiopianEuropeanFijianFilipinoFinnishFrenchFrench American IndianFrench CanadianGermanGerman RussianGhanaianGreekGuamanian/ChamorroGuatemalanGuyaneseHaitianHmongHonduranHopiHoumaHungarianIcelanderIndian (Asian)IndonesianInupiatIranianIraqiIrishIroquoisIsraeliItalianJamaicanJapaneseJordanianKenyanKiowaKoreanLaotianLatvianLebaneseLiberianLithuanianLumbeeLuxembourgerMacedonianMalaysianMalteseMarshalleseMenomineeMexicanMexican American IndianMongolianMoroccanNative HawaiianNavajoNepaleseNew ZealanderNicaraguanNigerianNorthern EuropeanNorwegianOkinawanOsageOttawaPaiutePakistaniPalestinianPanamanianParaguayanPennsylvania GermanPeruvianPimaPolishPortuguesePotawatomiPuebloPuerto RicanPuget Sound SalishRomanianRussianSalvadoranSamoanScandinavianScotch-IrishScottishSeminoleSenegaleseSerbianShoshoneSierra LeoneanSiouxSlavicSlovakSloveneSomaliSouth AfricanSouth AmericanSouth American IndianSoviet UnionSpaniardSpanishSpanish AmericanSpanish American IndianSri LankanSubsaharan AfricanSudaneseSwedishSwissSyrianTaiwaneseThaiTlingit-HaidaTohono O'OdhamTonganTrinidadian and TobagonianTsimshianTurkishU.S. Virgin IslanderUgandanUkrainianUruguayanUteVenezuelanVietnameseWelshWest IndianYakamaYaquiYugoslavianYumanYup'ikZimbabwean
Immigration
NonimmigrantsImmigrantsAfghanistanAfricaAlbaniaArgentinaArmeniaAsiaAustraliaAustriaBahamasBangladeshBarbadosBelarusBelgiumBelizeBoliviaBosnia and HerzegovinaBrazilBulgariaBurma/MyanmarCabo VerdeCambodiaCameroonCanadaCaribbeanCentral AmericaChileChinaColombiaCongoCosta RicaCroatiaCubaCzechoslovakiaDenmarkDominicaDominican RepublicEastern AfricaEastern AsiaEastern EuropeEcuadorEgyptEl SalvadorEnglandEritreaEthiopiaEuropeFijiFranceGermanyGhanaGreeceGrenadaGuatemalaGuyanaHaitiHondurasHong KongHungaryIndiaIndonesiaIranIraqIrelandIsraelItalyJamaicaJapanJordanKazakhstanKenyaKoreaKuwaitLaosLatin AmericaLatviaLebanonLiberiaLithuaniaMalaysiaMexicoMicronesiaMiddle AfricaMoldovaMoroccoNepalNetherlandsNicaraguaNigeriaNorth AmericaNorth MacedoniaNorthern AfricaNorthern EuropeNorwayOceaniaPakistanPanamaPeruPhilippinesPolandPortugalRomaniaRussiaSaudi ArabiaScotlandSenegalSerbiaSierra LeoneSingaporeSomaliaSouth AfricaSouth AmericaSouth Central AsiaSouth Eastern AsiaSouthern EuropeSpainSri LankaSt. Vincent and the GrenadinesSudanSwedenSwitzerlandSyriaTaiwanThailandTrinidad and TobagoTurkeyUgandaUkraineUruguayUzbekistanVenezuelaVietnamWest IndiesWestern AfricaWestern AsiaWestern EuropeYemenZimbabweAzores
Immigrants from Zaire
Race
Ancestry
AfghanAfricanAlaska NativeAlaskan AthabascanAlbanianAleutAlsatianAmericanApacheArabArapahoArgentineanArmenianAssyrian/Chaldean/SyriacAustralianAustrianBahamianBangladeshiBarbadianBasqueBelgianBelizeanBermudanBhutaneseBlackfeetBolivianBrazilianBritishBritish West IndianBulgarianBurmeseCajunCambodianCanadianCape VerdeanCarpatho RusynCelticCentral AmericanCentral American IndianCherokeeCheyenneChickasawChileanChineseChippewaChoctawColombianColvilleComancheCosta RicanCreeCreekCroatianCrowCubanCypriotCzechCzechoslovakianDanishDelawareDominicanDutchDutch West IndianEastern EuropeanEcuadorianEgyptianEnglishEstonianEthiopianEuropeanFijianFilipinoFinnishFrenchFrench American IndianFrench CanadianGermanGerman RussianGhanaianGreekGuamanian/ChamorroGuatemalanGuyaneseHaitianHmongHonduranHopiHoumaHungarianIcelanderIndian (Asian)IndonesianInupiatIranianIraqiIrishIroquoisIsraeliItalianJamaicanJapaneseJordanianKenyanKiowaKoreanLaotianLatvianLebaneseLiberianLithuanianLumbeeLuxembourgerMacedonianMalaysianMalteseMarshalleseMenomineeMexicanMexican American IndianMongolianMoroccanNative HawaiianNavajoNepaleseNew ZealanderNicaraguanNigerianNorthern EuropeanNorwegianOkinawanOsageOttawaPaiutePakistaniPanamanianParaguayanPennsylvania GermanPeruvianPimaPolishPortuguesePotawatomiPuebloPuerto RicanPuget Sound SalishRomanianRussianSalvadoranSamoanScandinavianScotch-IrishScottishSeminoleSenegaleseSerbianShoshoneSierra LeoneanSiouxSlavicSlovakSloveneSomaliSouth AfricanSouth AmericanSouth American IndianSoviet UnionSpaniardSpanishSpanish AmericanSpanish American IndianSri LankanSubsaharan AfricanSudaneseSwedishSwissSyrianTaiwaneseThaiTlingit-HaidaTohono O'OdhamTonganTrinidadian and TobagonianTsimshianTurkishU.S. Virgin IslanderUgandanUkrainianUruguayanUteVenezuelanVietnameseWelshWest IndianYakamaYaquiYugoslavianYumanYup'ikZimbabwean
Immigration
NonimmigrantsImmigrantsAfghanistanAfricaAlbaniaArgentinaArmeniaAsiaAustraliaAustriaBahamasBangladeshBarbadosBelarusBelgiumBelizeBoliviaBosnia and HerzegovinaBrazilBulgariaBurma/MyanmarCabo VerdeCambodiaCameroonCanadaCaribbeanCentral AmericaChileChinaColombiaCongoCosta RicaCroatiaCubaCzechoslovakiaDenmarkDominicaDominican RepublicEastern AfricaEastern AsiaEastern EuropeEcuadorEgyptEl SalvadorEnglandEritreaEthiopiaEuropeFijiFranceGermanyGhanaGreeceGrenadaGuatemalaGuyanaHaitiHondurasHong KongHungaryIndiaIndonesiaIranIraqIrelandIsraelItalyJamaicaJapanJordanKazakhstanKenyaKoreaKuwaitLaosLatin AmericaLatviaLebanonLiberiaLithuaniaMalaysiaMexicoMicronesiaMiddle AfricaMoldovaMoroccoNepalNetherlandsNicaraguaNigeriaNorth AmericaNorth MacedoniaNorthern AfricaNorthern EuropeNorwayOceaniaPakistanPanamaPeruPhilippinesPolandPortugalRomaniaRussiaSaudi ArabiaScotlandSenegalSerbiaSierra LeoneSingaporeSomaliaSouth AfricaSouth AmericaSouth Central AsiaSouth Eastern AsiaSouthern EuropeSpainSri LankaSt. Vincent and the GrenadinesSudanSwedenSwitzerlandSyriaTaiwanThailandTrinidad and TobagoTurkeyUgandaUkraineUruguayUzbekistanVenezuelaVietnamWest IndiesWestern AfricaWestern AsiaWestern EuropeYemenZaireZimbabweAzores
11th Grade
Income
Poverty
Unemployment
Labor Participation
Family Structure
Vehicle Availability
Education Level
Disability

11th Grade Comparison

Palestinians

Immigrants from Zaire

Exceptional
Tragic
93.4%
11TH GRADE
97.7/ 100
METRIC RATING
115th/ 347
METRIC RANK
91.9%
11TH GRADE
5.4/ 100
METRIC RATING
225th/ 347
METRIC RANK

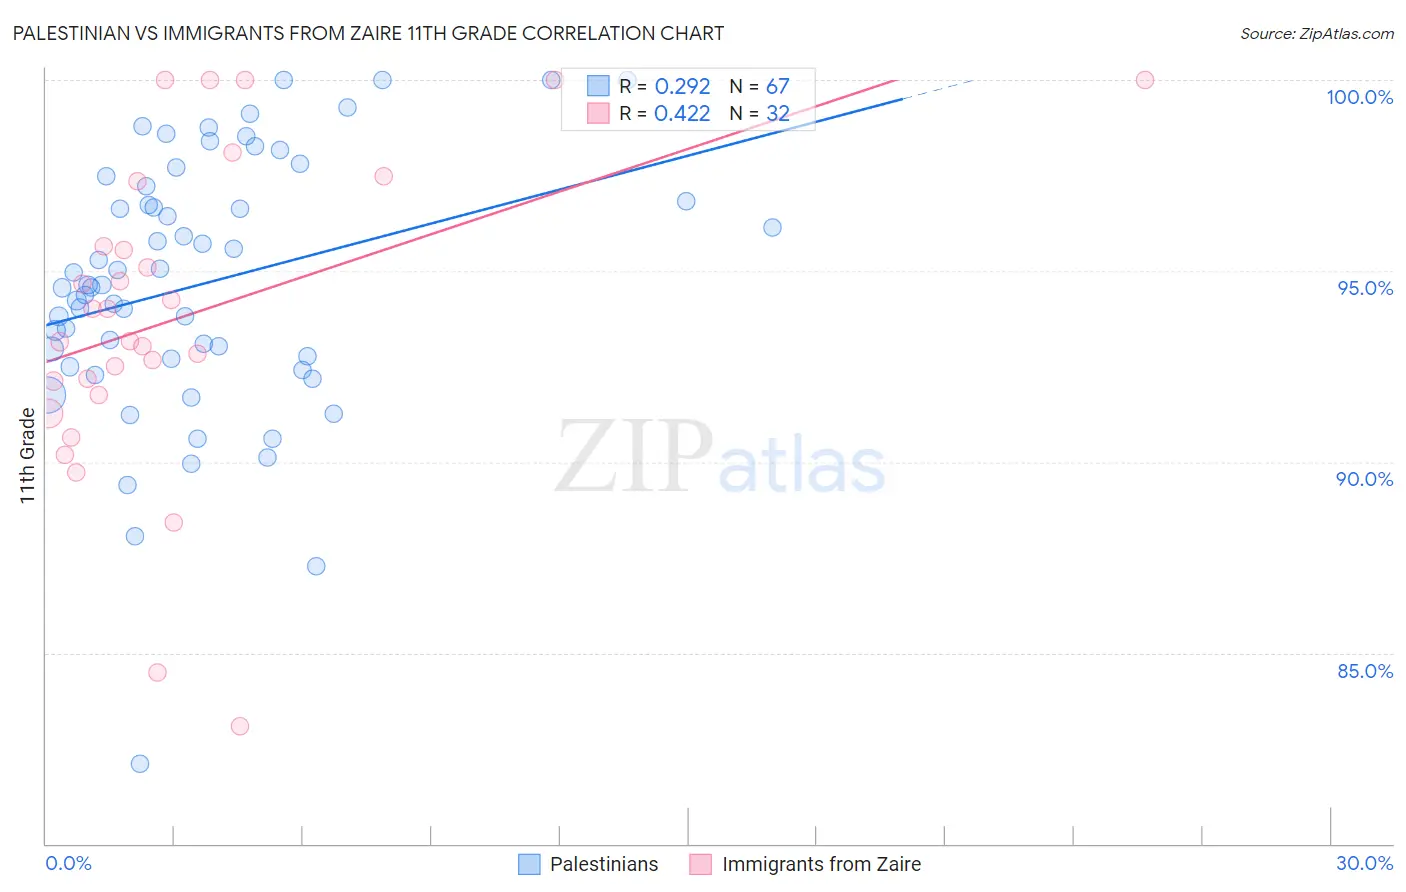
Palestinian vs Immigrants from Zaire 11th Grade Correlation Chart

The statistical analysis conducted on geographies consisting of 216,461,770 people shows a weak positive correlation between the proportion of Palestinians and percentage of population with at least 11th grade education in the United States with a correlation coefficient (R) of 0.292 and weighted average of 93.4%. Similarly, the statistical analysis conducted on geographies consisting of 107,255,805 people shows a moderate positive correlation between the proportion of Immigrants from Zaire and percentage of population with at least 11th grade education in the United States with a correlation coefficient (R) of 0.422 and weighted average of 91.9%, a difference of 1.6%.
Palestinian vs Immigrants from Zaire 11th Grade

11th Grade Correlation Summary

MeasurementPalestinianImmigrants from Zaire
Minimum82.1%83.1%
Maximum100.0%100.0%
Range17.9%16.9%
Mean94.7%93.8%
Median94.6%93.6%
Interquartile 25% (IQ1)92.7%91.9%
Interquartile 75% (IQ3)97.2%96.5%
Interquartile Range (IQR)4.5%4.6%
Standard Deviation (Sample)3.4%4.2%
Standard Deviation (Population)3.4%4.1%

Similar Demographics by 11th Grade

Demographics Similar to Palestinians by 11th Grade

In terms of 11th grade, the demographic groups most similar to Palestinians are Jordanian (93.4%, a difference of 0.010%), Immigrants from Zimbabwe (93.4%, a difference of 0.020%), Immigrants from Hungary (93.4%, a difference of 0.020%), White/Caucasian (93.3%, a difference of 0.030%), and Immigrants from Germany (93.4%, a difference of 0.040%).
DemographicsRating | Rank11th Grade
Alaska Natives
98.4
/100
|
#108
Exceptional
93.5%
Immigrants | Kuwait
98.4
/100
|
#109
Exceptional
93.5%
Syrians
98.4
/100
|
#110
Exceptional
93.4%
Yugoslavians
98.1
/100
|
#111
Exceptional
93.4%
Immigrants | Germany
98.0
/100
|
#112
Exceptional
93.4%
Immigrants | Zimbabwe
97.8
/100
|
#113
Exceptional
93.4%
Jordanians
97.8
/100
|
#114
Exceptional
93.4%
Palestinians
97.7
/100
|
#115
Exceptional
93.4%
Immigrants | Hungary
97.5
/100
|
#116
Exceptional
93.4%
Whites/Caucasians
97.4
/100
|
#117
Exceptional
93.3%
Immigrants | Korea
97.0
/100
|
#118
Exceptional
93.3%
Israelis
97.0
/100
|
#119
Exceptional
93.3%
Immigrants | Russia
96.6
/100
|
#120
Exceptional
93.3%
German Russians
96.4
/100
|
#121
Exceptional
93.3%
Immigrants | Belarus
96.3
/100
|
#122
Exceptional
93.3%

Demographics Similar to Immigrants from Zaire by 11th Grade

In terms of 11th grade, the demographic groups most similar to Immigrants from Zaire are Immigrants from Somalia (91.9%, a difference of 0.010%), Costa Rican (91.9%, a difference of 0.040%), Immigrants from Africa (91.9%, a difference of 0.050%), Immigrants from Bahamas (91.9%, a difference of 0.050%), and Immigrants from Cameroon (91.8%, a difference of 0.060%).
DemographicsRating | Rank11th Grade
Blackfeet
10.1
/100
|
#218
Poor
92.0%
Portuguese
10.0
/100
|
#219
Tragic
92.0%
South American Indians
7.6
/100
|
#220
Tragic
92.0%
Immigrants | Liberia
7.0
/100
|
#221
Tragic
91.9%
Immigrants | Africa
6.5
/100
|
#222
Tragic
91.9%
Immigrants | Bahamas
6.5
/100
|
#223
Tragic
91.9%
Costa Ricans
6.3
/100
|
#224
Tragic
91.9%
Immigrants | Zaire
5.4
/100
|
#225
Tragic
91.9%
Immigrants | Somalia
5.2
/100
|
#226
Tragic
91.9%
Immigrants | Cameroon
4.4
/100
|
#227
Tragic
91.8%
Immigrants | Panama
4.3
/100
|
#228
Tragic
91.8%
Nigerians
4.3
/100
|
#229
Tragic
91.8%
Immigrants | Afghanistan
3.9
/100
|
#230
Tragic
91.8%
Choctaw
3.7
/100
|
#231
Tragic
91.8%
Uruguayans
3.5
/100
|
#232
Tragic
91.8%