Palestinian vs Immigrants from China 1st Grade
COMPARE
Palestinian
Immigrants from China
1st Grade
1st Grade Comparison
Palestinians
Immigrants from China
98.0%
1ST GRADE
83.0/ 100
METRIC RATING
140th/ 347
METRIC RANK
97.4%
1ST GRADE
0.1/ 100
METRIC RATING
275th/ 347
METRIC RANK
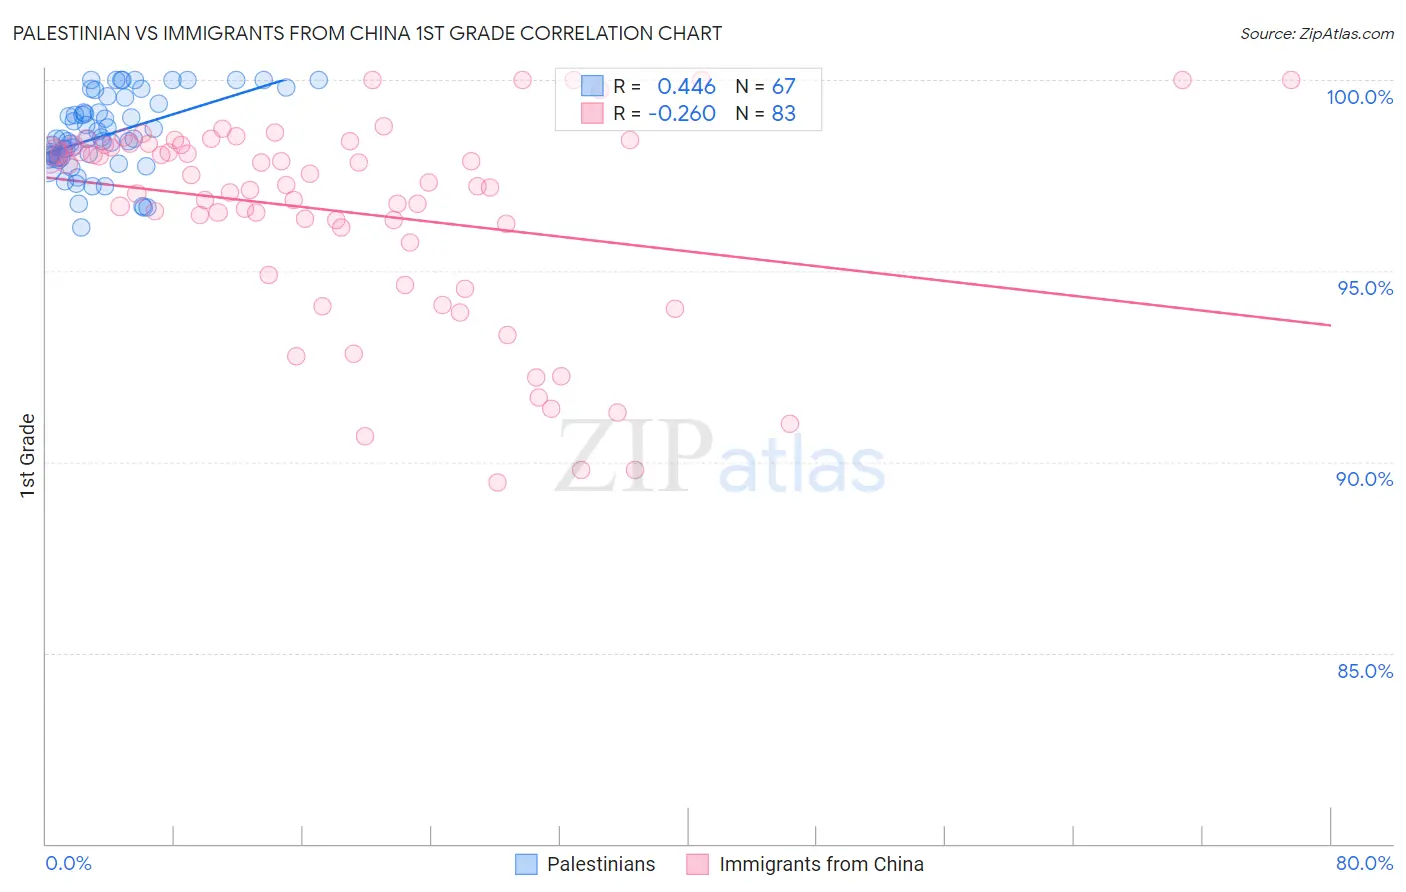
Palestinian vs Immigrants from China 1st Grade Correlation Chart
The statistical analysis conducted on geographies consisting of 216,457,008 people shows a moderate positive correlation between the proportion of Palestinians and percentage of population with at least 1st grade education in the United States with a correlation coefficient (R) of 0.446 and weighted average of 98.0%. Similarly, the statistical analysis conducted on geographies consisting of 457,082,957 people shows a weak negative correlation between the proportion of Immigrants from China and percentage of population with at least 1st grade education in the United States with a correlation coefficient (R) of -0.260 and weighted average of 97.4%, a difference of 0.65%.
1st Grade Correlation Summary
| Measurement | Palestinian | Immigrants from China |
| Minimum | 96.1% | 89.5% |
| Maximum | 100.0% | 100.0% |
| Range | 3.9% | 10.5% |
| Mean | 98.6% | 96.5% |
| Median | 98.5% | 97.3% |
| Interquartile 25% (IQ1) | 98.0% | 95.7% |
| Interquartile 75% (IQ3) | 99.4% | 98.3% |
| Interquartile Range (IQR) | 1.4% | 2.6% |
| Standard Deviation (Sample) | 1.00% | 2.6% |
| Standard Deviation (Population) | 0.99% | 2.6% |
Similar Demographics by 1st Grade
Demographics Similar to Palestinians by 1st Grade
In terms of 1st grade, the demographic groups most similar to Palestinians are Immigrants from Turkey (98.0%, a difference of 0.0%), Marshallese (98.0%, a difference of 0.010%), Burmese (98.0%, a difference of 0.010%), Alsatian (98.0%, a difference of 0.010%), and Hmong (98.0%, a difference of 0.020%).
| Demographics | Rating | Rank | 1st Grade |
| Immigrants | Europe | 90.5 /100 | #133 | Exceptional 98.1% |
| Immigrants | Hungary | 89.4 /100 | #134 | Excellent 98.1% |
| Immigrants | Kuwait | 89.3 /100 | #135 | Excellent 98.1% |
| Immigrants | Bulgaria | 88.8 /100 | #136 | Excellent 98.1% |
| Israelis | 87.8 /100 | #137 | Excellent 98.1% |
| Immigrants | Romania | 87.8 /100 | #138 | Excellent 98.1% |
| Blackfeet | 87.6 /100 | #139 | Excellent 98.1% |
| Palestinians | 83.0 /100 | #140 | Excellent 98.0% |
| Immigrants | Turkey | 82.8 /100 | #141 | Excellent 98.0% |
| Marshallese | 82.0 /100 | #142 | Excellent 98.0% |
| Burmese | 81.0 /100 | #143 | Excellent 98.0% |
| Alsatians | 80.9 /100 | #144 | Excellent 98.0% |
| Hmong | 79.0 /100 | #145 | Good 98.0% |
| Immigrants | Israel | 77.8 /100 | #146 | Good 98.0% |
| Filipinos | 77.6 /100 | #147 | Good 98.0% |
Demographics Similar to Immigrants from China by 1st Grade
In terms of 1st grade, the demographic groups most similar to Immigrants from China are Ghanaian (97.4%, a difference of 0.0%), Immigrants from Philippines (97.4%, a difference of 0.020%), Immigrants from Western Africa (97.4%, a difference of 0.020%), Immigrants from Bolivia (97.4%, a difference of 0.030%), and Immigrants from Cameroon (97.4%, a difference of 0.040%).
| Demographics | Rating | Rank | 1st Grade |
| Immigrants | Nigeria | 0.3 /100 | #268 | Tragic 97.5% |
| West Indians | 0.3 /100 | #269 | Tragic 97.5% |
| Immigrants | Jamaica | 0.2 /100 | #270 | Tragic 97.5% |
| Immigrants | Cameroon | 0.2 /100 | #271 | Tragic 97.4% |
| Immigrants | Peru | 0.2 /100 | #272 | Tragic 97.4% |
| Immigrants | Bolivia | 0.2 /100 | #273 | Tragic 97.4% |
| Ghanaians | 0.1 /100 | #274 | Tragic 97.4% |
| Immigrants | China | 0.1 /100 | #275 | Tragic 97.4% |
| Immigrants | Philippines | 0.1 /100 | #276 | Tragic 97.4% |
| Immigrants | Western Africa | 0.1 /100 | #277 | Tragic 97.4% |
| Immigrants | Uzbekistan | 0.1 /100 | #278 | Tragic 97.4% |
| Immigrants | Ghana | 0.1 /100 | #279 | Tragic 97.4% |
| Afghans | 0.1 /100 | #280 | Tragic 97.4% |
| Trinidadians and Tobagonians | 0.1 /100 | #281 | Tragic 97.3% |
| Barbadians | 0.1 /100 | #282 | Tragic 97.3% |