Pakistani vs Lithuanian Professional Degree
COMPARE
Pakistani
Lithuanian
Professional Degree
Professional Degree Comparison
Pakistanis
Lithuanians
4.8%
PROFESSIONAL DEGREE
90.9/ 100
METRIC RATING
132nd/ 347
METRIC RANK
5.4%
PROFESSIONAL DEGREE
99.8/ 100
METRIC RATING
72nd/ 347
METRIC RANK
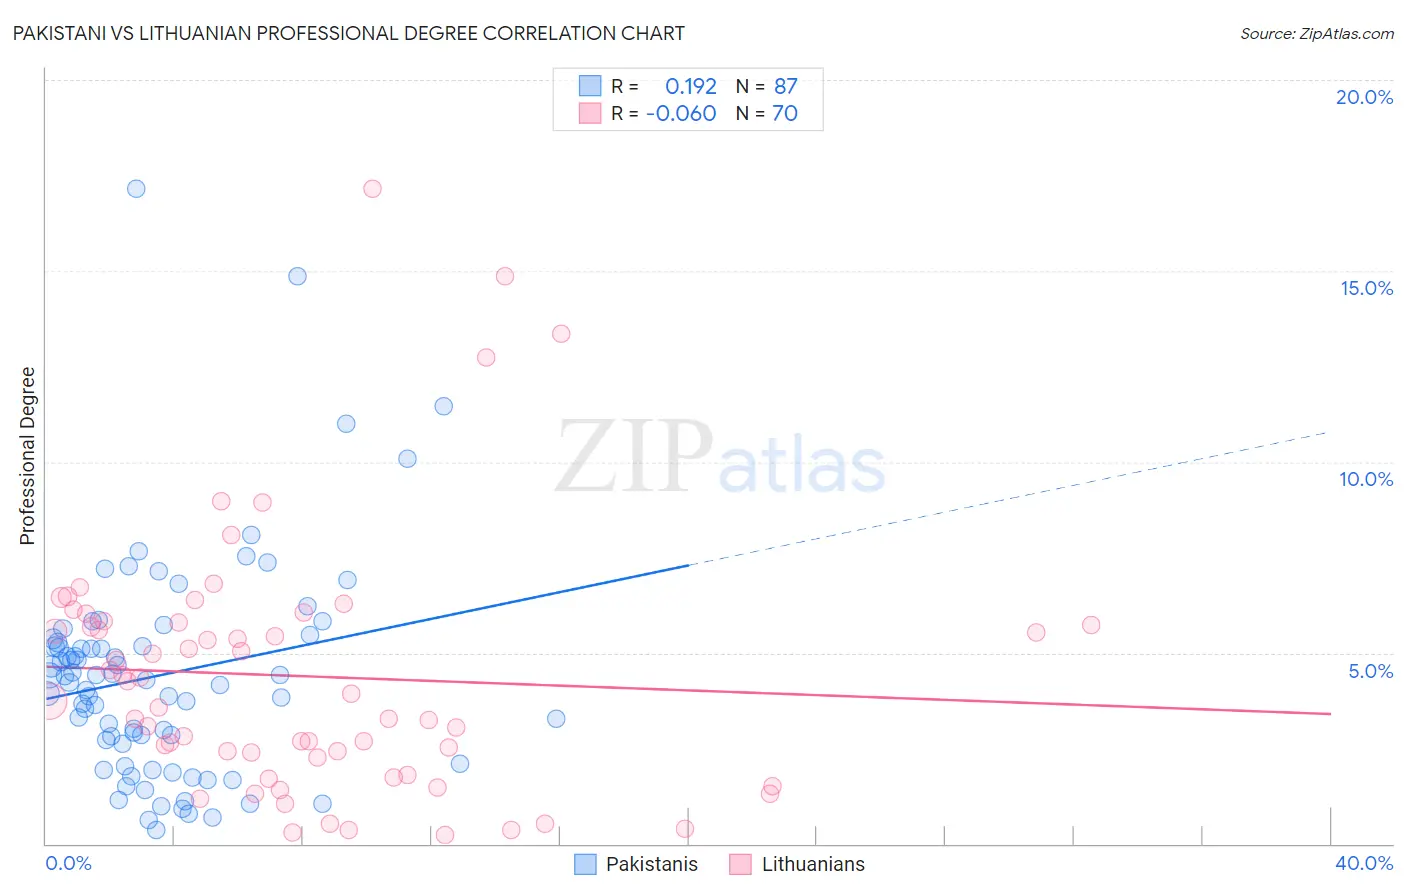
Pakistani vs Lithuanian Professional Degree Correlation Chart
The statistical analysis conducted on geographies consisting of 334,796,739 people shows a poor positive correlation between the proportion of Pakistanis and percentage of population with at least professional degree education in the United States with a correlation coefficient (R) of 0.192 and weighted average of 4.8%. Similarly, the statistical analysis conducted on geographies consisting of 420,702,228 people shows a slight negative correlation between the proportion of Lithuanians and percentage of population with at least professional degree education in the United States with a correlation coefficient (R) of -0.060 and weighted average of 5.4%, a difference of 12.7%.
Professional Degree Correlation Summary
| Measurement | Pakistani | Lithuanian |
| Minimum | 0.37% | 0.24% |
| Maximum | 17.1% | 17.2% |
| Range | 16.8% | 16.9% |
| Mean | 4.4% | 4.4% |
| Median | 4.3% | 3.8% |
| Interquartile 25% (IQ1) | 2.6% | 2.3% |
| Interquartile 75% (IQ3) | 5.4% | 5.8% |
| Interquartile Range (IQR) | 2.8% | 3.5% |
| Standard Deviation (Sample) | 2.9% | 3.4% |
| Standard Deviation (Population) | 2.9% | 3.3% |
Similar Demographics by Professional Degree
Demographics Similar to Pakistanis by Professional Degree
In terms of professional degree, the demographic groups most similar to Pakistanis are Immigrants from Nepal (4.8%, a difference of 0.22%), Icelander (4.8%, a difference of 0.25%), Italian (4.8%, a difference of 0.25%), Palestinian (4.8%, a difference of 0.27%), and South American Indian (4.8%, a difference of 0.38%).
| Demographics | Rating | Rank | Professional Degree |
| Immigrants | Albania | 93.3 /100 | #125 | Exceptional 4.8% |
| Europeans | 93.2 /100 | #126 | Exceptional 4.8% |
| Serbians | 92.6 /100 | #127 | Exceptional 4.8% |
| Immigrants | Eastern Africa | 92.5 /100 | #128 | Exceptional 4.8% |
| Palestinians | 91.5 /100 | #129 | Exceptional 4.8% |
| Icelanders | 91.5 /100 | #130 | Exceptional 4.8% |
| Immigrants | Nepal | 91.4 /100 | #131 | Exceptional 4.8% |
| Pakistanis | 90.9 /100 | #132 | Exceptional 4.8% |
| Italians | 90.2 /100 | #133 | Exceptional 4.8% |
| South American Indians | 89.9 /100 | #134 | Excellent 4.8% |
| Macedonians | 89.8 /100 | #135 | Excellent 4.8% |
| Immigrants | Jordan | 89.0 /100 | #136 | Excellent 4.7% |
| Jordanians | 88.9 /100 | #137 | Excellent 4.7% |
| Afghans | 88.8 /100 | #138 | Excellent 4.7% |
| South Americans | 85.6 /100 | #139 | Excellent 4.7% |
Demographics Similar to Lithuanians by Professional Degree
In terms of professional degree, the demographic groups most similar to Lithuanians are Immigrants from Romania (5.4%, a difference of 0.10%), Ethiopian (5.4%, a difference of 0.47%), Immigrants from Western Asia (5.4%, a difference of 0.48%), Immigrants from Indonesia (5.3%, a difference of 0.61%), and Immigrants from Canada (5.3%, a difference of 0.69%).
| Demographics | Rating | Rank | Professional Degree |
| Immigrants | Bolivia | 99.9 /100 | #65 | Exceptional 5.5% |
| Immigrants | Kazakhstan | 99.9 /100 | #66 | Exceptional 5.5% |
| Immigrants | Bulgaria | 99.9 /100 | #67 | Exceptional 5.5% |
| Immigrants | Lebanon | 99.9 /100 | #68 | Exceptional 5.5% |
| Immigrants | Hungary | 99.9 /100 | #69 | Exceptional 5.5% |
| Bhutanese | 99.8 /100 | #70 | Exceptional 5.4% |
| Immigrants | Western Asia | 99.8 /100 | #71 | Exceptional 5.4% |
| Lithuanians | 99.8 /100 | #72 | Exceptional 5.4% |
| Immigrants | Romania | 99.8 /100 | #73 | Exceptional 5.4% |
| Ethiopians | 99.7 /100 | #74 | Exceptional 5.4% |
| Immigrants | Indonesia | 99.7 /100 | #75 | Exceptional 5.3% |
| Immigrants | Canada | 99.7 /100 | #76 | Exceptional 5.3% |
| Immigrants | Ethiopia | 99.7 /100 | #77 | Exceptional 5.3% |
| Armenians | 99.7 /100 | #78 | Exceptional 5.3% |
| Immigrants | North America | 99.7 /100 | #79 | Exceptional 5.3% |