Ottawa vs Spaniard 9th Grade

COMPARE

Ottawa
Race
Ancestry
AfghanAfricanAlaska NativeAlaskan AthabascanAlbanianAleutAlsatianAmericanApacheArabArapahoArgentineanArmenianAssyrian/Chaldean/SyriacAustralianAustrianBahamianBangladeshiBarbadianBasqueBelgianBelizeanBermudanBhutaneseBlackfeetBolivianBrazilianBritishBritish West IndianBulgarianBurmeseCajunCambodianCanadianCape VerdeanCarpatho RusynCelticCentral AmericanCentral American IndianCherokeeCheyenneChickasawChileanChineseChippewaChoctawColombianColvilleComancheCosta RicanCreeCreekCroatianCrowCubanCypriotCzechCzechoslovakianDanishDelawareDominicanDutchDutch West IndianEastern EuropeanEcuadorianEgyptianEnglishEstonianEthiopianEuropeanFijianFilipinoFinnishFrenchFrench American IndianFrench CanadianGermanGerman RussianGhanaianGreekGuamanian/ChamorroGuatemalanGuyaneseHaitianHmongHonduranHopiHoumaHungarianIcelanderIndian (Asian)IndonesianInupiatIranianIraqiIrishIroquoisIsraeliItalianJamaicanJapaneseJordanianKenyanKiowaKoreanLaotianLatvianLebaneseLiberianLithuanianLumbeeLuxembourgerMacedonianMalaysianMalteseMarshalleseMenomineeMexicanMexican American IndianMongolianMoroccanNative HawaiianNavajoNepaleseNew ZealanderNicaraguanNigerianNorthern EuropeanNorwegianOkinawanOsageOttawaPaiutePakistaniPalestinianPanamanianParaguayanPennsylvania GermanPeruvianPimaPolishPortuguesePotawatomiPuebloPuerto RicanPuget Sound SalishRomanianRussianSalvadoranSamoanScandinavianScotch-IrishScottishSeminoleSenegaleseSerbianShoshoneSierra LeoneanSiouxSlavicSlovakSloveneSomaliSouth AfricanSouth AmericanSouth American IndianSoviet UnionSpanishSpanish AmericanSpanish American IndianSri LankanSubsaharan AfricanSudaneseSwedishSwissSyrianTaiwaneseThaiTlingit-HaidaTohono O'OdhamTonganTrinidadian and TobagonianTsimshianTurkishU.S. Virgin IslanderUgandanUkrainianUruguayanUteVenezuelanVietnameseWelshWest IndianYakamaYaquiYugoslavianYumanYup'ikZimbabwean
Immigration
NonimmigrantsImmigrantsAfghanistanAfricaAlbaniaArgentinaArmeniaAsiaAustraliaAustriaBahamasBangladeshBarbadosBelarusBelgiumBelizeBoliviaBosnia and HerzegovinaBrazilBulgariaBurma/MyanmarCabo VerdeCambodiaCameroonCanadaCaribbeanCentral AmericaChileChinaColombiaCongoCosta RicaCroatiaCubaCzechoslovakiaDenmarkDominicaDominican RepublicEastern AfricaEastern AsiaEastern EuropeEcuadorEgyptEl SalvadorEnglandEritreaEthiopiaEuropeFijiFranceGermanyGhanaGreeceGrenadaGuatemalaGuyanaHaitiHondurasHong KongHungaryIndiaIndonesiaIranIraqIrelandIsraelItalyJamaicaJapanJordanKazakhstanKenyaKoreaKuwaitLaosLatin AmericaLatviaLebanonLiberiaLithuaniaMalaysiaMexicoMicronesiaMiddle AfricaMoldovaMoroccoNepalNetherlandsNicaraguaNigeriaNorth AmericaNorth MacedoniaNorthern AfricaNorthern EuropeNorwayOceaniaPakistanPanamaPeruPhilippinesPolandPortugalRomaniaRussiaSaudi ArabiaScotlandSenegalSerbiaSierra LeoneSingaporeSomaliaSouth AfricaSouth AmericaSouth Central AsiaSouth Eastern AsiaSouthern EuropeSpainSri LankaSt. Vincent and the GrenadinesSudanSwedenSwitzerlandSyriaTaiwanThailandTrinidad and TobagoTurkeyUgandaUkraineUruguayUzbekistanVenezuelaVietnamWest IndiesWestern AfricaWestern AsiaWestern EuropeYemenZaireZimbabweAzores
Spaniard
Race
Ancestry
AfghanAfricanAlaska NativeAlaskan AthabascanAlbanianAleutAlsatianAmericanApacheArabArapahoArgentineanArmenianAssyrian/Chaldean/SyriacAustralianAustrianBahamianBangladeshiBarbadianBasqueBelgianBelizeanBermudanBhutaneseBlackfeetBolivianBrazilianBritishBritish West IndianBulgarianBurmeseCajunCambodianCanadianCape VerdeanCarpatho RusynCelticCentral AmericanCentral American IndianCherokeeCheyenneChickasawChileanChineseChippewaChoctawColombianColvilleComancheCosta RicanCreeCreekCroatianCrowCubanCypriotCzechCzechoslovakianDanishDelawareDominicanDutchDutch West IndianEastern EuropeanEcuadorianEgyptianEnglishEstonianEthiopianEuropeanFijianFilipinoFinnishFrenchFrench American IndianFrench CanadianGermanGerman RussianGhanaianGreekGuamanian/ChamorroGuatemalanGuyaneseHaitianHmongHonduranHopiHoumaHungarianIcelanderIndian (Asian)IndonesianInupiatIranianIraqiIrishIroquoisIsraeliItalianJamaicanJapaneseJordanianKenyanKiowaKoreanLaotianLatvianLebaneseLiberianLithuanianLumbeeLuxembourgerMacedonianMalaysianMalteseMarshalleseMenomineeMexicanMexican American IndianMongolianMoroccanNative HawaiianNavajoNepaleseNew ZealanderNicaraguanNigerianNorthern EuropeanNorwegianOkinawanOsagePaiutePakistaniPalestinianPanamanianParaguayanPennsylvania GermanPeruvianPimaPolishPortuguesePotawatomiPuebloPuerto RicanPuget Sound SalishRomanianRussianSalvadoranSamoanScandinavianScotch-IrishScottishSeminoleSenegaleseSerbianShoshoneSierra LeoneanSiouxSlavicSlovakSloveneSomaliSouth AfricanSouth AmericanSouth American IndianSoviet UnionSpaniardSpanishSpanish AmericanSpanish American IndianSri LankanSubsaharan AfricanSudaneseSwedishSwissSyrianTaiwaneseThaiTlingit-HaidaTohono O'OdhamTonganTrinidadian and TobagonianTsimshianTurkishU.S. Virgin IslanderUgandanUkrainianUruguayanUteVenezuelanVietnameseWelshWest IndianYakamaYaquiYugoslavianYumanYup'ikZimbabwean
Immigration
NonimmigrantsImmigrantsAfghanistanAfricaAlbaniaArgentinaArmeniaAsiaAustraliaAustriaBahamasBangladeshBarbadosBelarusBelgiumBelizeBoliviaBosnia and HerzegovinaBrazilBulgariaBurma/MyanmarCabo VerdeCambodiaCameroonCanadaCaribbeanCentral AmericaChileChinaColombiaCongoCosta RicaCroatiaCubaCzechoslovakiaDenmarkDominicaDominican RepublicEastern AfricaEastern AsiaEastern EuropeEcuadorEgyptEl SalvadorEnglandEritreaEthiopiaEuropeFijiFranceGermanyGhanaGreeceGrenadaGuatemalaGuyanaHaitiHondurasHong KongHungaryIndiaIndonesiaIranIraqIrelandIsraelItalyJamaicaJapanJordanKazakhstanKenyaKoreaKuwaitLaosLatin AmericaLatviaLebanonLiberiaLithuaniaMalaysiaMexicoMicronesiaMiddle AfricaMoldovaMoroccoNepalNetherlandsNicaraguaNigeriaNorth AmericaNorth MacedoniaNorthern AfricaNorthern EuropeNorwayOceaniaPakistanPanamaPeruPhilippinesPolandPortugalRomaniaRussiaSaudi ArabiaScotlandSenegalSerbiaSierra LeoneSingaporeSomaliaSouth AfricaSouth AmericaSouth Central AsiaSouth Eastern AsiaSouthern EuropeSpainSri LankaSt. Vincent and the GrenadinesSudanSwedenSwitzerlandSyriaTaiwanThailandTrinidad and TobagoTurkeyUgandaUkraineUruguayUzbekistanVenezuelaVietnamWest IndiesWestern AfricaWestern AsiaWestern EuropeYemenZaireZimbabweAzores
9th Grade
Income
Poverty
Unemployment
Labor Participation
Family Structure
Vehicle Availability
Education Level
Disability

9th Grade Comparison

Ottawa

Spaniards

Exceptional
Average
96.1%
9TH GRADE
99.9/ 100
METRIC RATING
39th/ 347
METRIC RANK
94.9%
9TH GRADE
59.6/ 100
METRIC RATING
169th/ 347
METRIC RANK

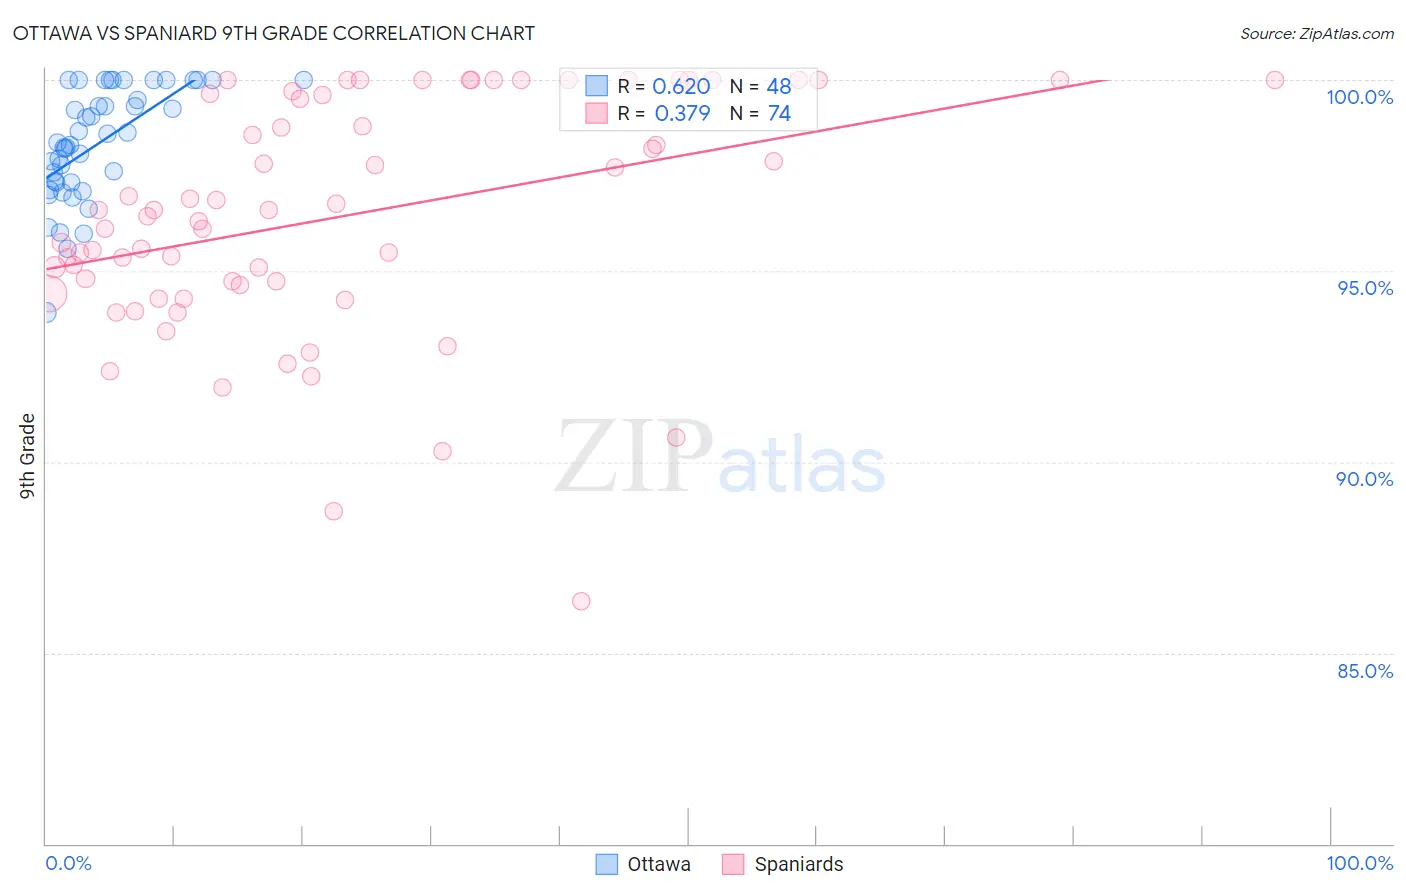
Ottawa vs Spaniard 9th Grade Correlation Chart

The statistical analysis conducted on geographies consisting of 49,956,726 people shows a significant positive correlation between the proportion of Ottawa and percentage of population with at least 9th grade education in the United States with a correlation coefficient (R) of 0.620 and weighted average of 96.1%. Similarly, the statistical analysis conducted on geographies consisting of 443,543,963 people shows a mild positive correlation between the proportion of Spaniards and percentage of population with at least 9th grade education in the United States with a correlation coefficient (R) of 0.379 and weighted average of 94.9%, a difference of 1.3%.
Ottawa vs Spaniard 9th Grade

9th Grade Correlation Summary

MeasurementOttawaSpaniard
Minimum93.9%86.4%
Maximum100.0%100.0%
Range6.1%13.6%
Mean98.3%96.4%
Median98.3%96.5%
Interquartile 25% (IQ1)97.3%94.6%
Interquartile 75% (IQ3)99.7%99.6%
Interquartile Range (IQR)2.4%5.0%
Standard Deviation (Sample)1.5%3.1%
Standard Deviation (Population)1.4%3.0%

Similar Demographics by 9th Grade

Demographics Similar to Ottawa by 9th Grade

In terms of 9th grade, the demographic groups most similar to Ottawa are Estonian (96.1%, a difference of 0.020%), Immigrants from Scotland (96.1%, a difference of 0.020%), Slavic (96.1%, a difference of 0.020%), Czechoslovakian (96.1%, a difference of 0.030%), and Chippewa (96.1%, a difference of 0.030%).
DemographicsRating | Rank9th Grade
Belgians
100.0
/100
|
#32
Exceptional
96.3%
Luxembourgers
100.0
/100
|
#33
Exceptional
96.3%
Hungarians
100.0
/100
|
#34
Exceptional
96.2%
Bulgarians
99.9
/100
|
#35
Exceptional
96.2%
Northern Europeans
99.9
/100
|
#36
Exceptional
96.2%
Estonians
99.9
/100
|
#37
Exceptional
96.1%
Immigrants | Scotland
99.9
/100
|
#38
Exceptional
96.1%
Ottawa
99.9
/100
|
#39
Exceptional
96.1%
Slavs
99.9
/100
|
#40
Exceptional
96.1%
Czechoslovakians
99.9
/100
|
#41
Exceptional
96.1%
Chippewa
99.9
/100
|
#42
Exceptional
96.1%
Iranians
99.9
/100
|
#43
Exceptional
96.1%
Alaska Natives
99.9
/100
|
#44
Exceptional
96.1%
Crow
99.9
/100
|
#45
Exceptional
96.1%
Immigrants | India
99.9
/100
|
#46
Exceptional
96.1%

Demographics Similar to Spaniards by 9th Grade

In terms of 9th grade, the demographic groups most similar to Spaniards are Immigrants from Brazil (95.0%, a difference of 0.010%), Chilean (95.0%, a difference of 0.010%), Alsatian (94.9%, a difference of 0.010%), Colville (94.9%, a difference of 0.010%), and Blackfeet (95.0%, a difference of 0.020%).
DemographicsRating | Rank9th Grade
Bermudans
65.8
/100
|
#162
Good
95.0%
Pakistanis
64.1
/100
|
#163
Good
95.0%
Venezuelans
63.6
/100
|
#164
Good
95.0%
Blackfeet
62.6
/100
|
#165
Good
95.0%
Ute
62.6
/100
|
#166
Good
95.0%
Immigrants | Brazil
61.1
/100
|
#167
Good
95.0%
Chileans
60.7
/100
|
#168
Good
95.0%
Spaniards
59.6
/100
|
#169
Average
94.9%
Alsatians
58.6
/100
|
#170
Average
94.9%
Colville
58.5
/100
|
#171
Average
94.9%
Iraqis
54.0
/100
|
#172
Average
94.9%
Cheyenne
51.5
/100
|
#173
Average
94.9%
Immigrants | Egypt
50.0
/100
|
#174
Average
94.9%
Brazilians
49.8
/100
|
#175
Average
94.9%
Immigrants | Spain
49.1
/100
|
#176
Average
94.9%