Osage vs Immigrants from Italy Master's Degree
COMPARE
Osage
Immigrants from Italy
Master's Degree
Master's Degree Comparison
Osage
Immigrants from Italy
12.6%
MASTER'S DEGREE
0.7/ 100
METRIC RATING
257th/ 347
METRIC RANK
17.2%
MASTER'S DEGREE
99.1/ 100
METRIC RATING
93rd/ 347
METRIC RANK
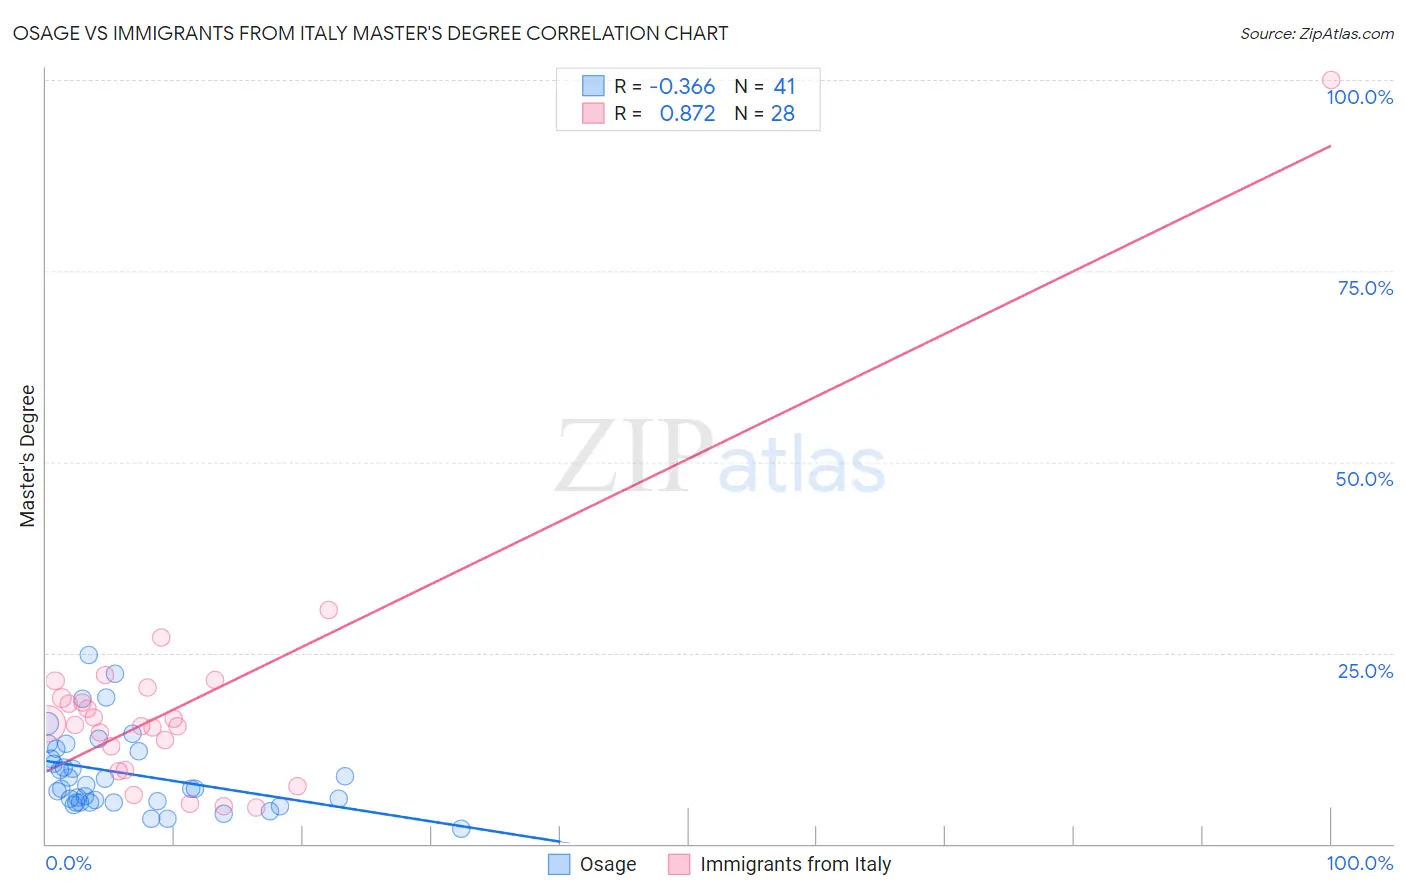
Osage vs Immigrants from Italy Master's Degree Correlation Chart
The statistical analysis conducted on geographies consisting of 91,790,824 people shows a mild negative correlation between the proportion of Osage and percentage of population with at least master's degree education in the United States with a correlation coefficient (R) of -0.366 and weighted average of 12.6%. Similarly, the statistical analysis conducted on geographies consisting of 324,197,750 people shows a very strong positive correlation between the proportion of Immigrants from Italy and percentage of population with at least master's degree education in the United States with a correlation coefficient (R) of 0.872 and weighted average of 17.2%, a difference of 36.5%.
Master's Degree Correlation Summary
| Measurement | Osage | Immigrants from Italy |
| Minimum | 1.9% | 4.8% |
| Maximum | 24.8% | 100.0% |
| Range | 22.9% | 95.2% |
| Mean | 9.2% | 18.4% |
| Median | 7.2% | 15.6% |
| Interquartile 25% (IQ1) | 5.5% | 11.2% |
| Interquartile 75% (IQ3) | 12.3% | 19.7% |
| Interquartile Range (IQR) | 6.9% | 8.5% |
| Standard Deviation (Sample) | 5.3% | 17.2% |
| Standard Deviation (Population) | 5.2% | 16.9% |
Similar Demographics by Master's Degree
Demographics Similar to Osage by Master's Degree
In terms of master's degree, the demographic groups most similar to Osage are Immigrants from Portugal (12.6%, a difference of 0.48%), Immigrants from Liberia (12.5%, a difference of 0.50%), Immigrants from Congo (12.6%, a difference of 0.55%), Indonesian (12.6%, a difference of 0.58%), and Japanese (12.5%, a difference of 0.59%).
| Demographics | Rating | Rank | Master's Degree |
| Liberians | 1.3 /100 | #250 | Tragic 12.8% |
| Tlingit-Haida | 1.3 /100 | #251 | Tragic 12.8% |
| French American Indians | 1.0 /100 | #252 | Tragic 12.7% |
| Immigrants | Dominica | 0.8 /100 | #253 | Tragic 12.6% |
| Indonesians | 0.8 /100 | #254 | Tragic 12.6% |
| Immigrants | Congo | 0.8 /100 | #255 | Tragic 12.6% |
| Immigrants | Portugal | 0.8 /100 | #256 | Tragic 12.6% |
| Osage | 0.7 /100 | #257 | Tragic 12.6% |
| Immigrants | Liberia | 0.6 /100 | #258 | Tragic 12.5% |
| Japanese | 0.6 /100 | #259 | Tragic 12.5% |
| Dominicans | 0.6 /100 | #260 | Tragic 12.5% |
| Tongans | 0.6 /100 | #261 | Tragic 12.5% |
| Nicaraguans | 0.6 /100 | #262 | Tragic 12.5% |
| Central American Indians | 0.5 /100 | #263 | Tragic 12.4% |
| Belizeans | 0.5 /100 | #264 | Tragic 12.4% |
Demographics Similar to Immigrants from Italy by Master's Degree
In terms of master's degree, the demographic groups most similar to Immigrants from Italy are Immigrants from North America (17.2%, a difference of 0.060%), Romanian (17.2%, a difference of 0.11%), Ugandan (17.1%, a difference of 0.13%), Immigrants from Egypt (17.2%, a difference of 0.18%), and Bhutanese (17.2%, a difference of 0.20%).
| Demographics | Rating | Rank | Master's Degree |
| Immigrants | Croatia | 99.3 /100 | #86 | Exceptional 17.3% |
| Maltese | 99.3 /100 | #87 | Exceptional 17.3% |
| Immigrants | Canada | 99.2 /100 | #88 | Exceptional 17.2% |
| Bhutanese | 99.1 /100 | #89 | Exceptional 17.2% |
| Immigrants | Egypt | 99.1 /100 | #90 | Exceptional 17.2% |
| Romanians | 99.1 /100 | #91 | Exceptional 17.2% |
| Immigrants | North America | 99.1 /100 | #92 | Exceptional 17.2% |
| Immigrants | Italy | 99.1 /100 | #93 | Exceptional 17.2% |
| Ugandans | 99.0 /100 | #94 | Exceptional 17.1% |
| Immigrants | Morocco | 98.9 /100 | #95 | Exceptional 17.1% |
| Immigrants | Northern Africa | 98.9 /100 | #96 | Exceptional 17.1% |
| Immigrants | England | 98.8 /100 | #97 | Exceptional 17.0% |
| Immigrants | Ukraine | 98.8 /100 | #98 | Exceptional 17.0% |
| Laotians | 98.8 /100 | #99 | Exceptional 17.0% |
| Albanians | 98.7 /100 | #100 | Exceptional 17.0% |