Osage vs Immigrants from Hong Kong 6th Grade
COMPARE
Osage
Immigrants from Hong Kong
6th Grade
6th Grade Comparison
Osage
Immigrants from Hong Kong
97.6%
6TH GRADE
99.3/ 100
METRIC RATING
80th/ 347
METRIC RANK
96.3%
6TH GRADE
0.2/ 100
METRIC RATING
271st/ 347
METRIC RANK
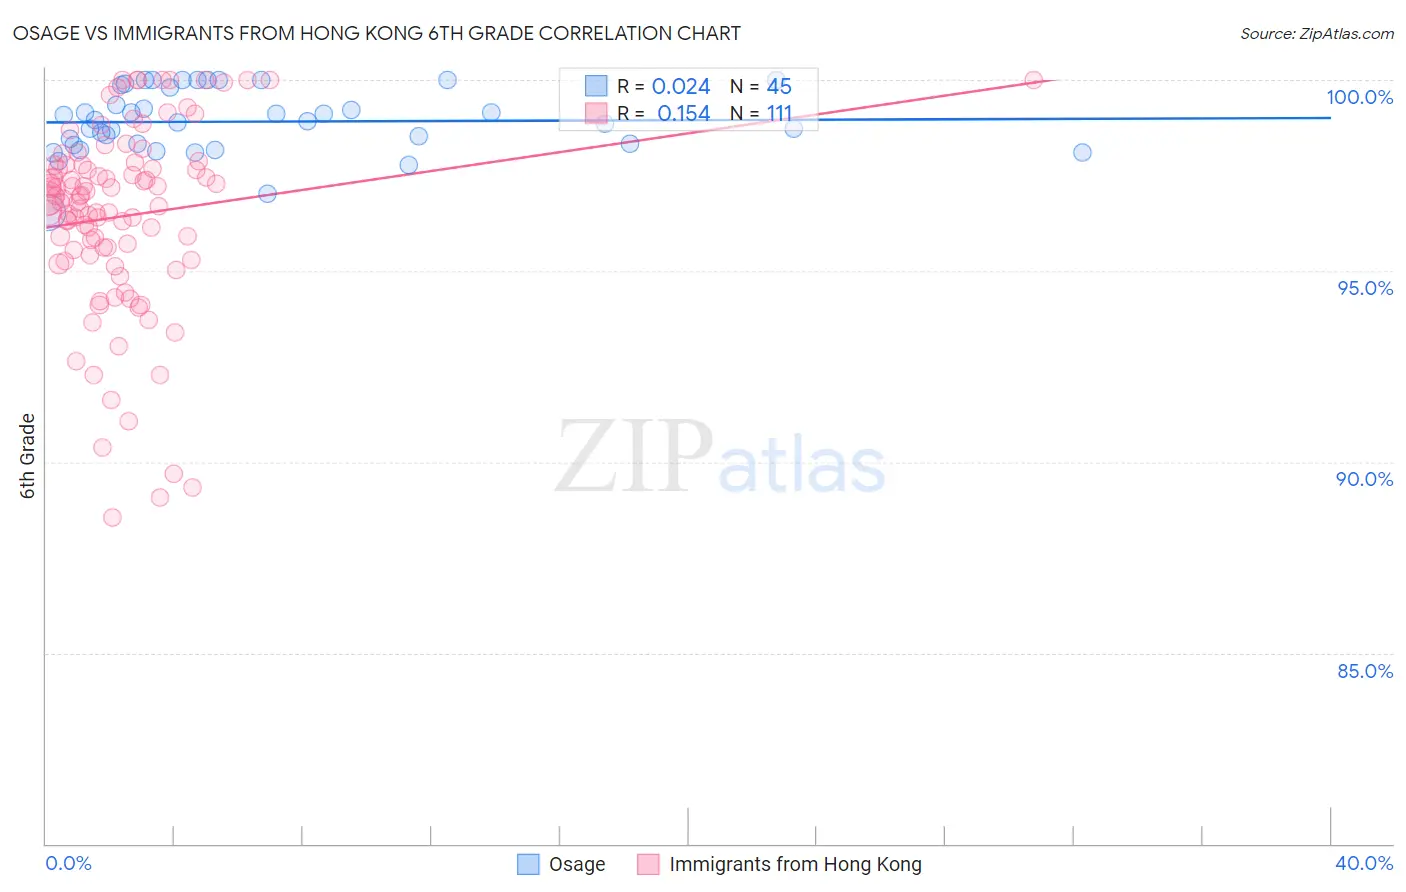
Osage vs Immigrants from Hong Kong 6th Grade Correlation Chart
The statistical analysis conducted on geographies consisting of 91,808,929 people shows no correlation between the proportion of Osage and percentage of population with at least 6th grade education in the United States with a correlation coefficient (R) of 0.024 and weighted average of 97.6%. Similarly, the statistical analysis conducted on geographies consisting of 253,909,193 people shows a poor positive correlation between the proportion of Immigrants from Hong Kong and percentage of population with at least 6th grade education in the United States with a correlation coefficient (R) of 0.154 and weighted average of 96.3%, a difference of 1.3%.
6th Grade Correlation Summary
| Measurement | Osage | Immigrants from Hong Kong |
| Minimum | 96.5% | 88.6% |
| Maximum | 100.0% | 100.0% |
| Range | 3.5% | 11.4% |
| Mean | 98.9% | 96.4% |
| Median | 98.9% | 96.9% |
| Interquartile 25% (IQ1) | 98.3% | 95.4% |
| Interquartile 75% (IQ3) | 99.8% | 97.8% |
| Interquartile Range (IQR) | 1.5% | 2.4% |
| Standard Deviation (Sample) | 0.84% | 2.5% |
| Standard Deviation (Population) | 0.83% | 2.5% |
Similar Demographics by 6th Grade
Demographics Similar to Osage by 6th Grade
In terms of 6th grade, the demographic groups most similar to Osage are Immigrants from India (97.6%, a difference of 0.0%), Immigrants from Lithuania (97.6%, a difference of 0.010%), Icelander (97.6%, a difference of 0.010%), Lumbee (97.6%, a difference of 0.010%), and Immigrants from Netherlands (97.6%, a difference of 0.020%).
| Demographics | Rating | Rank | 6th Grade |
| Cherokee | 99.4 /100 | #73 | Exceptional 97.6% |
| Immigrants | Netherlands | 99.4 /100 | #74 | Exceptional 97.6% |
| Ukrainians | 99.4 /100 | #75 | Exceptional 97.6% |
| Immigrants | England | 99.4 /100 | #76 | Exceptional 97.6% |
| Immigrants | Lithuania | 99.3 /100 | #77 | Exceptional 97.6% |
| Icelanders | 99.3 /100 | #78 | Exceptional 97.6% |
| Immigrants | India | 99.3 /100 | #79 | Exceptional 97.6% |
| Osage | 99.3 /100 | #80 | Exceptional 97.6% |
| Lumbee | 99.2 /100 | #81 | Exceptional 97.6% |
| Zimbabweans | 99.1 /100 | #82 | Exceptional 97.6% |
| Potawatomi | 99.1 /100 | #83 | Exceptional 97.6% |
| Shoshone | 99.0 /100 | #84 | Exceptional 97.6% |
| Delaware | 98.9 /100 | #85 | Exceptional 97.6% |
| Immigrants | Belgium | 98.9 /100 | #86 | Exceptional 97.5% |
| Puget Sound Salish | 98.9 /100 | #87 | Exceptional 97.5% |
Demographics Similar to Immigrants from Hong Kong by 6th Grade
In terms of 6th grade, the demographic groups most similar to Immigrants from Hong Kong are Immigrants from Uzbekistan (96.3%, a difference of 0.010%), West Indian (96.3%, a difference of 0.010%), Immigrants from South America (96.3%, a difference of 0.010%), Immigrants from Bolivia (96.3%, a difference of 0.030%), and Ghanaian (96.4%, a difference of 0.040%).
| Demographics | Rating | Rank | 6th Grade |
| Armenians | 0.3 /100 | #264 | Tragic 96.4% |
| Immigrants | Jamaica | 0.2 /100 | #265 | Tragic 96.4% |
| Ghanaians | 0.2 /100 | #266 | Tragic 96.4% |
| Afghans | 0.2 /100 | #267 | Tragic 96.4% |
| Immigrants | Uzbekistan | 0.2 /100 | #268 | Tragic 96.3% |
| West Indians | 0.2 /100 | #269 | Tragic 96.3% |
| Immigrants | South America | 0.2 /100 | #270 | Tragic 96.3% |
| Immigrants | Hong Kong | 0.2 /100 | #271 | Tragic 96.3% |
| Immigrants | Bolivia | 0.1 /100 | #272 | Tragic 96.3% |
| Immigrants | Cameroon | 0.1 /100 | #273 | Tragic 96.3% |
| Immigrants | Philippines | 0.1 /100 | #274 | Tragic 96.3% |
| Immigrants | Ghana | 0.1 /100 | #275 | Tragic 96.3% |
| Yaqui | 0.1 /100 | #276 | Tragic 96.3% |
| Immigrants | Western Africa | 0.1 /100 | #277 | Tragic 96.3% |
| Immigrants | Thailand | 0.1 /100 | #278 | Tragic 96.3% |