Osage vs Immigrants from Eritrea Bachelor's Degree
COMPARE
Osage
Immigrants from Eritrea
Bachelor's Degree
Bachelor's Degree Comparison
Osage
Immigrants from Eritrea
33.0%
BACHELOR'S DEGREE
0.5/ 100
METRIC RATING
259th/ 347
METRIC RANK
40.4%
BACHELOR'S DEGREE
94.3/ 100
METRIC RATING
124th/ 347
METRIC RANK
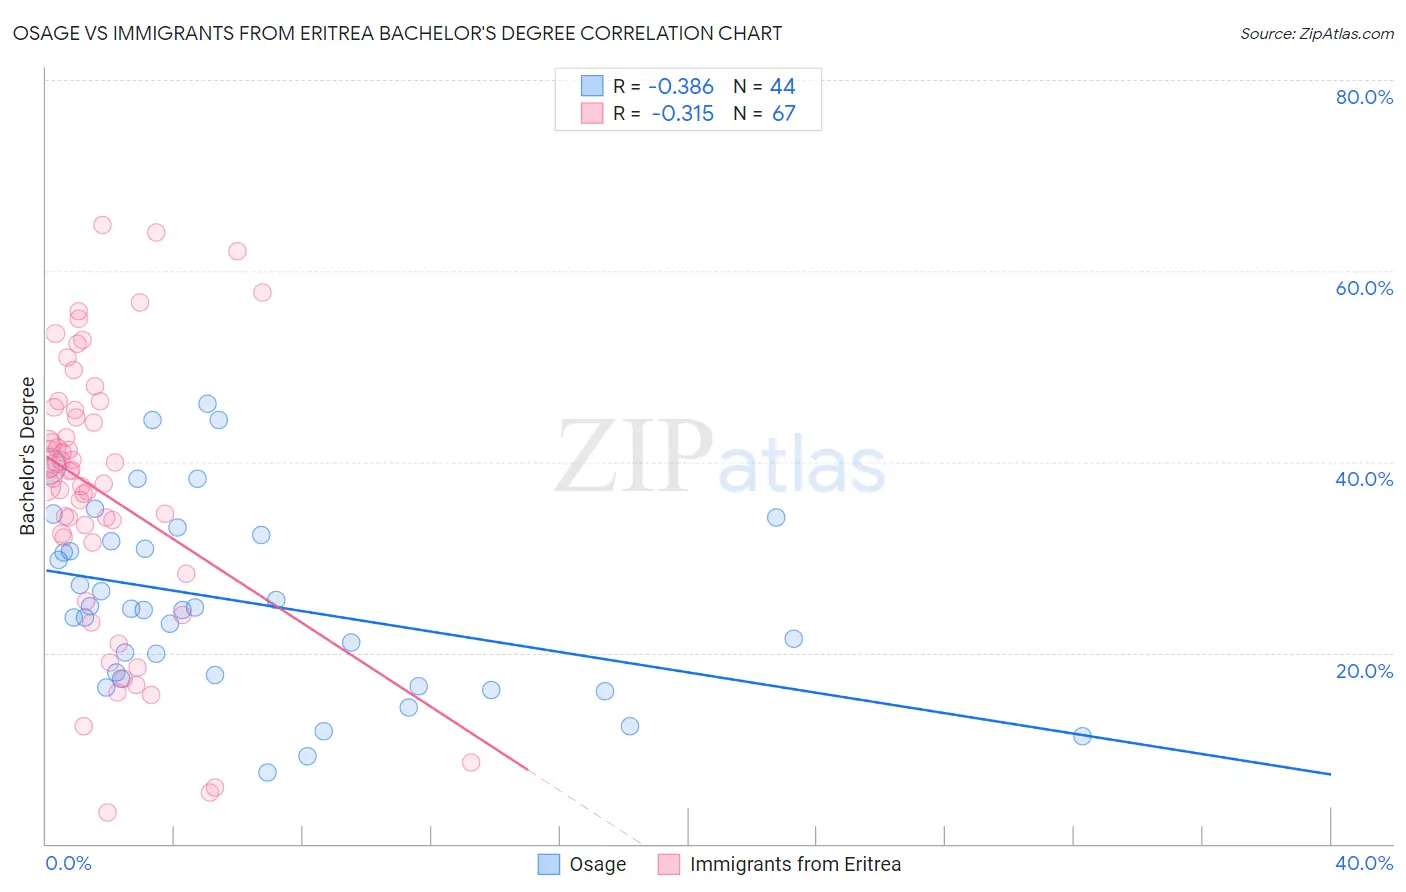
Osage vs Immigrants from Eritrea Bachelor's Degree Correlation Chart
The statistical analysis conducted on geographies consisting of 91,806,618 people shows a mild negative correlation between the proportion of Osage and percentage of population with at least bachelor's degree education in the United States with a correlation coefficient (R) of -0.386 and weighted average of 33.0%. Similarly, the statistical analysis conducted on geographies consisting of 104,855,166 people shows a mild negative correlation between the proportion of Immigrants from Eritrea and percentage of population with at least bachelor's degree education in the United States with a correlation coefficient (R) of -0.315 and weighted average of 40.4%, a difference of 22.3%.
Bachelor's Degree Correlation Summary
| Measurement | Osage | Immigrants from Eritrea |
| Minimum | 7.5% | 3.2% |
| Maximum | 46.2% | 64.8% |
| Range | 38.7% | 61.6% |
| Mean | 25.3% | 36.7% |
| Median | 24.5% | 39.0% |
| Interquartile 25% (IQ1) | 17.5% | 31.5% |
| Interquartile 75% (IQ3) | 32.0% | 45.4% |
| Interquartile Range (IQR) | 14.6% | 13.9% |
| Standard Deviation (Sample) | 9.7% | 14.2% |
| Standard Deviation (Population) | 9.6% | 14.1% |
Similar Demographics by Bachelor's Degree
Demographics Similar to Osage by Bachelor's Degree
In terms of bachelor's degree, the demographic groups most similar to Osage are French American Indian (33.1%, a difference of 0.050%), Spanish American (33.1%, a difference of 0.090%), Nicaraguan (33.1%, a difference of 0.31%), Malaysian (32.9%, a difference of 0.36%), and African (32.9%, a difference of 0.45%).
| Demographics | Rating | Rank | Bachelor's Degree |
| Immigrants | Bahamas | 0.7 /100 | #252 | Tragic 33.3% |
| U.S. Virgin Islanders | 0.7 /100 | #253 | Tragic 33.2% |
| Native Hawaiians | 0.7 /100 | #254 | Tragic 33.2% |
| Iroquois | 0.7 /100 | #255 | Tragic 33.2% |
| Nicaraguans | 0.6 /100 | #256 | Tragic 33.1% |
| Spanish Americans | 0.6 /100 | #257 | Tragic 33.1% |
| French American Indians | 0.6 /100 | #258 | Tragic 33.1% |
| Osage | 0.5 /100 | #259 | Tragic 33.0% |
| Malaysians | 0.5 /100 | #260 | Tragic 32.9% |
| Africans | 0.5 /100 | #261 | Tragic 32.9% |
| Immigrants | Jamaica | 0.5 /100 | #262 | Tragic 32.9% |
| Belizeans | 0.4 /100 | #263 | Tragic 32.8% |
| Central American Indians | 0.3 /100 | #264 | Tragic 32.5% |
| Bahamians | 0.3 /100 | #265 | Tragic 32.5% |
| Immigrants | Dominica | 0.3 /100 | #266 | Tragic 32.5% |
Demographics Similar to Immigrants from Eritrea by Bachelor's Degree
In terms of bachelor's degree, the demographic groups most similar to Immigrants from Eritrea are Lebanese (40.4%, a difference of 0.0%), Immigrants from Albania (40.4%, a difference of 0.020%), British (40.4%, a difference of 0.030%), Immigrants from Eastern Africa (40.4%, a difference of 0.080%), and Moroccan (40.5%, a difference of 0.12%).
| Demographics | Rating | Rank | Bachelor's Degree |
| Austrians | 95.5 /100 | #117 | Exceptional 40.6% |
| Croatians | 95.5 /100 | #118 | Exceptional 40.6% |
| Immigrants | Syria | 94.9 /100 | #119 | Exceptional 40.5% |
| Venezuelans | 94.7 /100 | #120 | Exceptional 40.5% |
| Moroccans | 94.6 /100 | #121 | Exceptional 40.5% |
| Immigrants | Albania | 94.4 /100 | #122 | Exceptional 40.4% |
| Lebanese | 94.3 /100 | #123 | Exceptional 40.4% |
| Immigrants | Eritrea | 94.3 /100 | #124 | Exceptional 40.4% |
| British | 94.2 /100 | #125 | Exceptional 40.4% |
| Immigrants | Eastern Africa | 94.1 /100 | #126 | Exceptional 40.4% |
| Immigrants | Jordan | 93.4 /100 | #127 | Exceptional 40.3% |
| Immigrants | Venezuela | 92.9 /100 | #128 | Exceptional 40.2% |
| Serbians | 92.4 /100 | #129 | Exceptional 40.1% |
| Sierra Leoneans | 92.2 /100 | #130 | Exceptional 40.1% |
| Italians | 91.9 /100 | #131 | Exceptional 40.1% |