Okinawan vs Mongolian 12th Grade, No Diploma
COMPARE
Okinawan
Mongolian
12th Grade, No Diploma
12th Grade, No Diploma Comparison
Okinawans
Mongolians
93.0%
12TH GRADE, NO DIPLOMA
99.9/ 100
METRIC RATING
34th/ 347
METRIC RANK
91.8%
12TH GRADE, NO DIPLOMA
89.9/ 100
METRIC RATING
128th/ 347
METRIC RANK
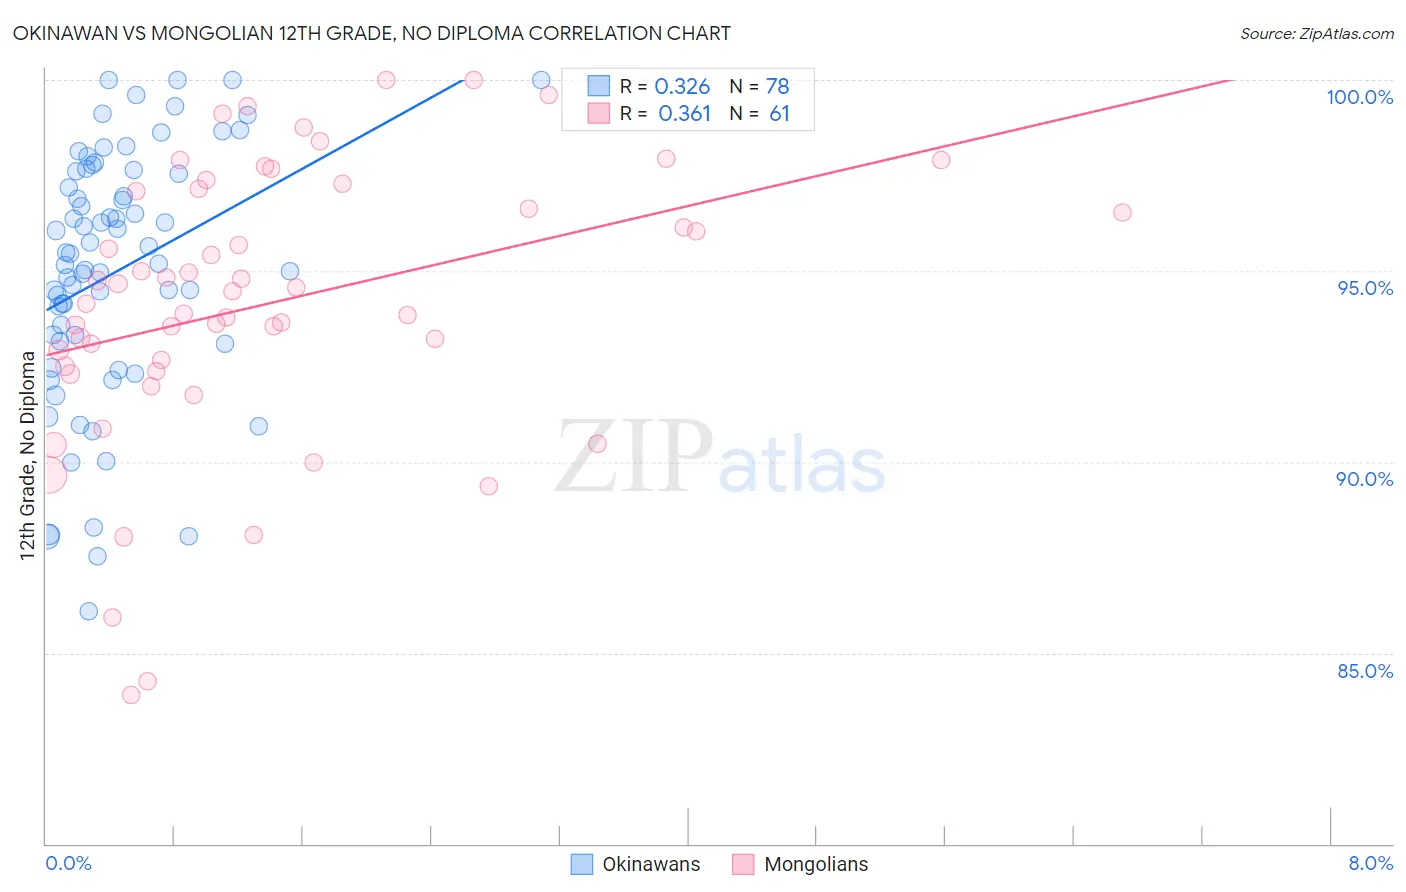
Okinawan vs Mongolian 12th Grade, No Diploma Correlation Chart
The statistical analysis conducted on geographies consisting of 73,775,797 people shows a mild positive correlation between the proportion of Okinawans and percentage of population with at least 12th grade (no diploma) education in the United States with a correlation coefficient (R) of 0.326 and weighted average of 93.0%. Similarly, the statistical analysis conducted on geographies consisting of 140,362,004 people shows a mild positive correlation between the proportion of Mongolians and percentage of population with at least 12th grade (no diploma) education in the United States with a correlation coefficient (R) of 0.361 and weighted average of 91.8%, a difference of 1.3%.
12th Grade, No Diploma Correlation Summary
| Measurement | Okinawan | Mongolian |
| Minimum | 86.1% | 83.9% |
| Maximum | 100.0% | 100.0% |
| Range | 13.9% | 16.1% |
| Mean | 95.0% | 94.2% |
| Median | 95.3% | 94.5% |
| Interquartile 25% (IQ1) | 93.2% | 92.4% |
| Interquartile 75% (IQ3) | 97.6% | 97.1% |
| Interquartile Range (IQR) | 4.4% | 4.7% |
| Standard Deviation (Sample) | 3.3% | 3.6% |
| Standard Deviation (Population) | 3.3% | 3.6% |
Similar Demographics by 12th Grade, No Diploma
Demographics Similar to Okinawans by 12th Grade, No Diploma
In terms of 12th grade, no diploma, the demographic groups most similar to Okinawans are English (93.0%, a difference of 0.0%), Scottish (93.0%, a difference of 0.010%), Irish (93.0%, a difference of 0.010%), Immigrants from Scotland (93.0%, a difference of 0.020%), and Tlingit-Haida (93.0%, a difference of 0.040%).
| Demographics | Rating | Rank | 12th Grade, No Diploma |
| Cypriots | 99.9 /100 | #27 | Exceptional 93.1% |
| Immigrants | Northern Europe | 99.9 /100 | #28 | Exceptional 93.1% |
| Iranians | 99.9 /100 | #29 | Exceptional 93.1% |
| Immigrants | Lithuania | 99.9 /100 | #30 | Exceptional 93.1% |
| Immigrants | Ireland | 99.9 /100 | #31 | Exceptional 93.1% |
| Europeans | 99.9 /100 | #32 | Exceptional 93.1% |
| Immigrants | Scotland | 99.9 /100 | #33 | Exceptional 93.0% |
| Okinawans | 99.9 /100 | #34 | Exceptional 93.0% |
| English | 99.9 /100 | #35 | Exceptional 93.0% |
| Scottish | 99.9 /100 | #36 | Exceptional 93.0% |
| Irish | 99.9 /100 | #37 | Exceptional 93.0% |
| Tlingit-Haida | 99.8 /100 | #38 | Exceptional 93.0% |
| Immigrants | Austria | 99.8 /100 | #39 | Exceptional 93.0% |
| Turks | 99.8 /100 | #40 | Exceptional 93.0% |
| Bhutanese | 99.8 /100 | #41 | Exceptional 93.0% |
Demographics Similar to Mongolians by 12th Grade, No Diploma
In terms of 12th grade, no diploma, the demographic groups most similar to Mongolians are German Russian (91.8%, a difference of 0.010%), Assyrian/Chaldean/Syriac (91.8%, a difference of 0.010%), Albanian (91.8%, a difference of 0.020%), Immigrants from Eastern Asia (91.8%, a difference of 0.020%), and Immigrants from Jordan (91.8%, a difference of 0.040%).
| Demographics | Rating | Rank | 12th Grade, No Diploma |
| Menominee | 93.5 /100 | #121 | Exceptional 91.9% |
| Ottawa | 93.1 /100 | #122 | Exceptional 91.9% |
| Egyptians | 92.5 /100 | #123 | Exceptional 91.9% |
| Immigrants | Ukraine | 91.6 /100 | #124 | Exceptional 91.8% |
| Whites/Caucasians | 91.6 /100 | #125 | Exceptional 91.8% |
| Basques | 91.3 /100 | #126 | Exceptional 91.8% |
| Immigrants | Jordan | 91.0 /100 | #127 | Exceptional 91.8% |
| Mongolians | 89.9 /100 | #128 | Excellent 91.8% |
| German Russians | 89.8 /100 | #129 | Excellent 91.8% |
| Assyrians/Chaldeans/Syriacs | 89.6 /100 | #130 | Excellent 91.8% |
| Albanians | 89.3 /100 | #131 | Excellent 91.8% |
| Immigrants | Eastern Asia | 89.3 /100 | #132 | Excellent 91.8% |
| Immigrants | Italy | 88.3 /100 | #133 | Excellent 91.7% |
| Venezuelans | 88.2 /100 | #134 | Excellent 91.7% |
| Immigrants | Bosnia and Herzegovina | 87.3 /100 | #135 | Excellent 91.7% |