Okinawan vs Laotian Professional Degree
COMPARE
Okinawan
Laotian
Professional Degree
Professional Degree Comparison
Okinawans
Laotians
7.3%
PROFESSIONAL DEGREE
100.0/ 100
METRIC RATING
6th/ 347
METRIC RANK
5.2%
PROFESSIONAL DEGREE
99.5/ 100
METRIC RATING
91st/ 347
METRIC RANK
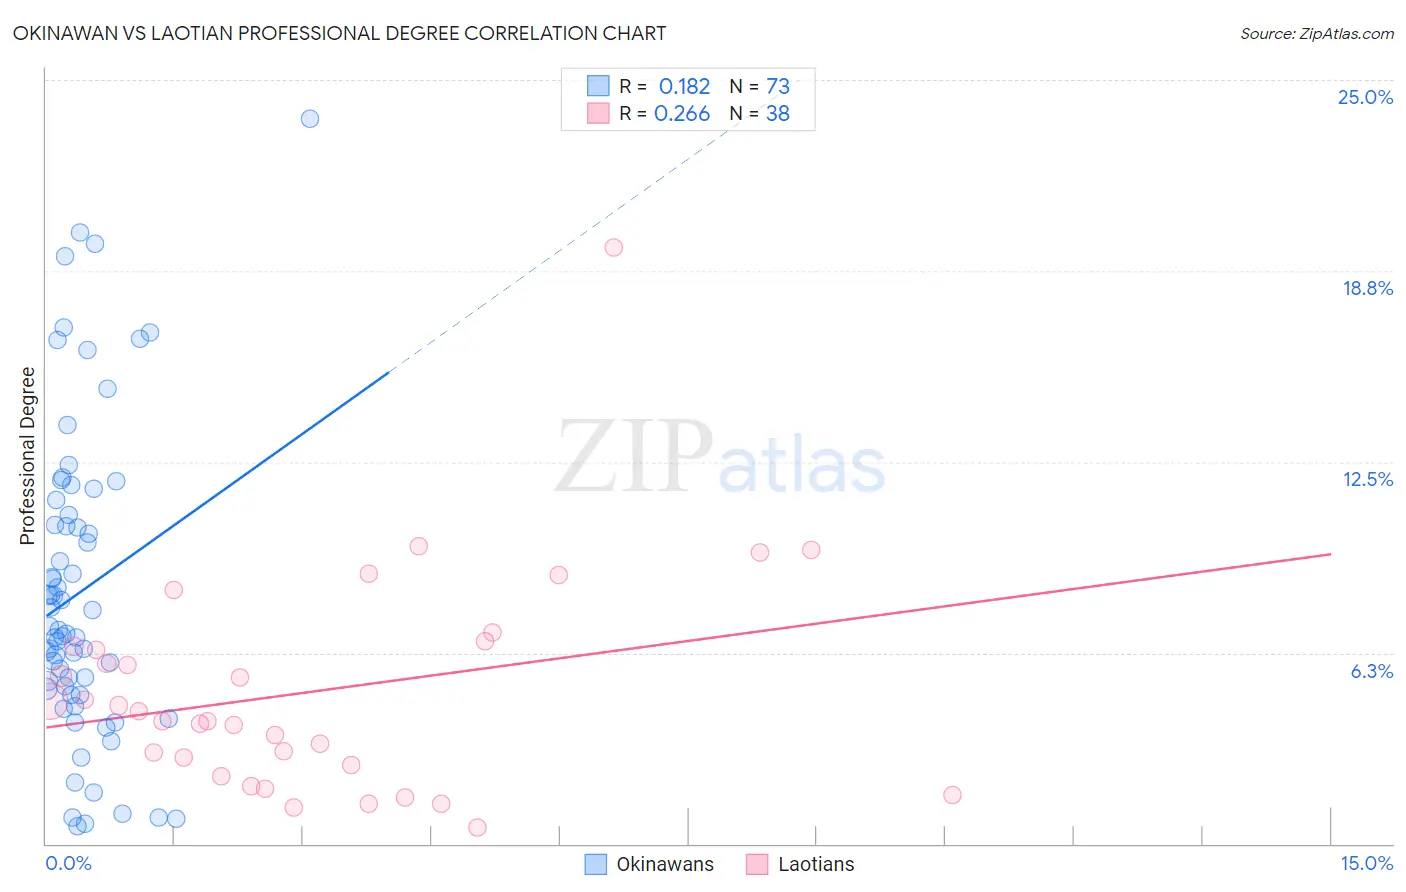
Okinawan vs Laotian Professional Degree Correlation Chart
The statistical analysis conducted on geographies consisting of 73,726,679 people shows a poor positive correlation between the proportion of Okinawans and percentage of population with at least professional degree education in the United States with a correlation coefficient (R) of 0.182 and weighted average of 7.3%. Similarly, the statistical analysis conducted on geographies consisting of 224,668,924 people shows a weak positive correlation between the proportion of Laotians and percentage of population with at least professional degree education in the United States with a correlation coefficient (R) of 0.266 and weighted average of 5.2%, a difference of 39.5%.
Professional Degree Correlation Summary
| Measurement | Okinawan | Laotian |
| Minimum | 0.58% | 0.53% |
| Maximum | 23.7% | 19.5% |
| Range | 23.1% | 19.0% |
| Mean | 8.3% | 5.0% |
| Median | 7.0% | 4.2% |
| Interquartile 25% (IQ1) | 5.0% | 2.6% |
| Interquartile 75% (IQ3) | 11.0% | 6.5% |
| Interquartile Range (IQR) | 6.0% | 3.9% |
| Standard Deviation (Sample) | 5.1% | 3.6% |
| Standard Deviation (Population) | 5.0% | 3.5% |
Similar Demographics by Professional Degree
Demographics Similar to Okinawans by Professional Degree
In terms of professional degree, the demographic groups most similar to Okinawans are Immigrants from Iran (7.3%, a difference of 0.11%), Eastern European (7.1%, a difference of 3.2%), Immigrants from Switzerland (7.1%, a difference of 3.3%), Filipino (7.6%, a difference of 3.4%), and Immigrants from Taiwan (7.1%, a difference of 3.5%).
| Demographics | Rating | Rank | Professional Degree |
| Immigrants | Israel | 100.0 /100 | #1 | Exceptional 7.9% |
| Immigrants | Singapore | 100.0 /100 | #2 | Exceptional 7.7% |
| Iranians | 100.0 /100 | #3 | Exceptional 7.6% |
| Filipinos | 100.0 /100 | #4 | Exceptional 7.6% |
| Immigrants | Iran | 100.0 /100 | #5 | Exceptional 7.3% |
| Okinawans | 100.0 /100 | #6 | Exceptional 7.3% |
| Eastern Europeans | 100.0 /100 | #7 | Exceptional 7.1% |
| Immigrants | Switzerland | 100.0 /100 | #8 | Exceptional 7.1% |
| Immigrants | Taiwan | 100.0 /100 | #9 | Exceptional 7.1% |
| Immigrants | Belgium | 100.0 /100 | #10 | Exceptional 7.0% |
| Cypriots | 100.0 /100 | #11 | Exceptional 6.9% |
| Israelis | 100.0 /100 | #12 | Exceptional 6.9% |
| Immigrants | Australia | 100.0 /100 | #13 | Exceptional 6.9% |
| Immigrants | France | 100.0 /100 | #14 | Exceptional 6.8% |
| Immigrants | China | 100.0 /100 | #15 | Exceptional 6.7% |
Demographics Similar to Laotians by Professional Degree
In terms of professional degree, the demographic groups most similar to Laotians are Immigrants from Eastern Europe (5.2%, a difference of 0.040%), Immigrants from Scotland (5.3%, a difference of 0.16%), Chilean (5.3%, a difference of 0.26%), Egyptian (5.3%, a difference of 0.27%), and Immigrants from Chile (5.3%, a difference of 0.41%).
| Demographics | Rating | Rank | Professional Degree |
| Immigrants | Croatia | 99.6 /100 | #84 | Exceptional 5.3% |
| Immigrants | Zimbabwe | 99.6 /100 | #85 | Exceptional 5.3% |
| Greeks | 99.6 /100 | #86 | Exceptional 5.3% |
| Immigrants | Chile | 99.5 /100 | #87 | Exceptional 5.3% |
| Egyptians | 99.5 /100 | #88 | Exceptional 5.3% |
| Chileans | 99.5 /100 | #89 | Exceptional 5.3% |
| Immigrants | Scotland | 99.5 /100 | #90 | Exceptional 5.3% |
| Laotians | 99.5 /100 | #91 | Exceptional 5.2% |
| Immigrants | Eastern Europe | 99.5 /100 | #92 | Exceptional 5.2% |
| Northern Europeans | 99.3 /100 | #93 | Exceptional 5.2% |
| Alsatians | 99.3 /100 | #94 | Exceptional 5.2% |
| Zimbabweans | 99.3 /100 | #95 | Exceptional 5.2% |
| Immigrants | Uzbekistan | 99.2 /100 | #96 | Exceptional 5.2% |
| Syrians | 99.1 /100 | #97 | Exceptional 5.2% |
| Austrians | 99.1 /100 | #98 | Exceptional 5.2% |