Okinawan vs Immigrants from Taiwan Kindergarten
COMPARE
Okinawan
Immigrants from Taiwan
Kindergarten
Kindergarten Comparison
Okinawans
Immigrants from Taiwan
98.2%
KINDERGARTEN
94.4/ 100
METRIC RATING
120th/ 347
METRIC RANK
97.9%
KINDERGARTEN
30.7/ 100
METRIC RATING
191st/ 347
METRIC RANK
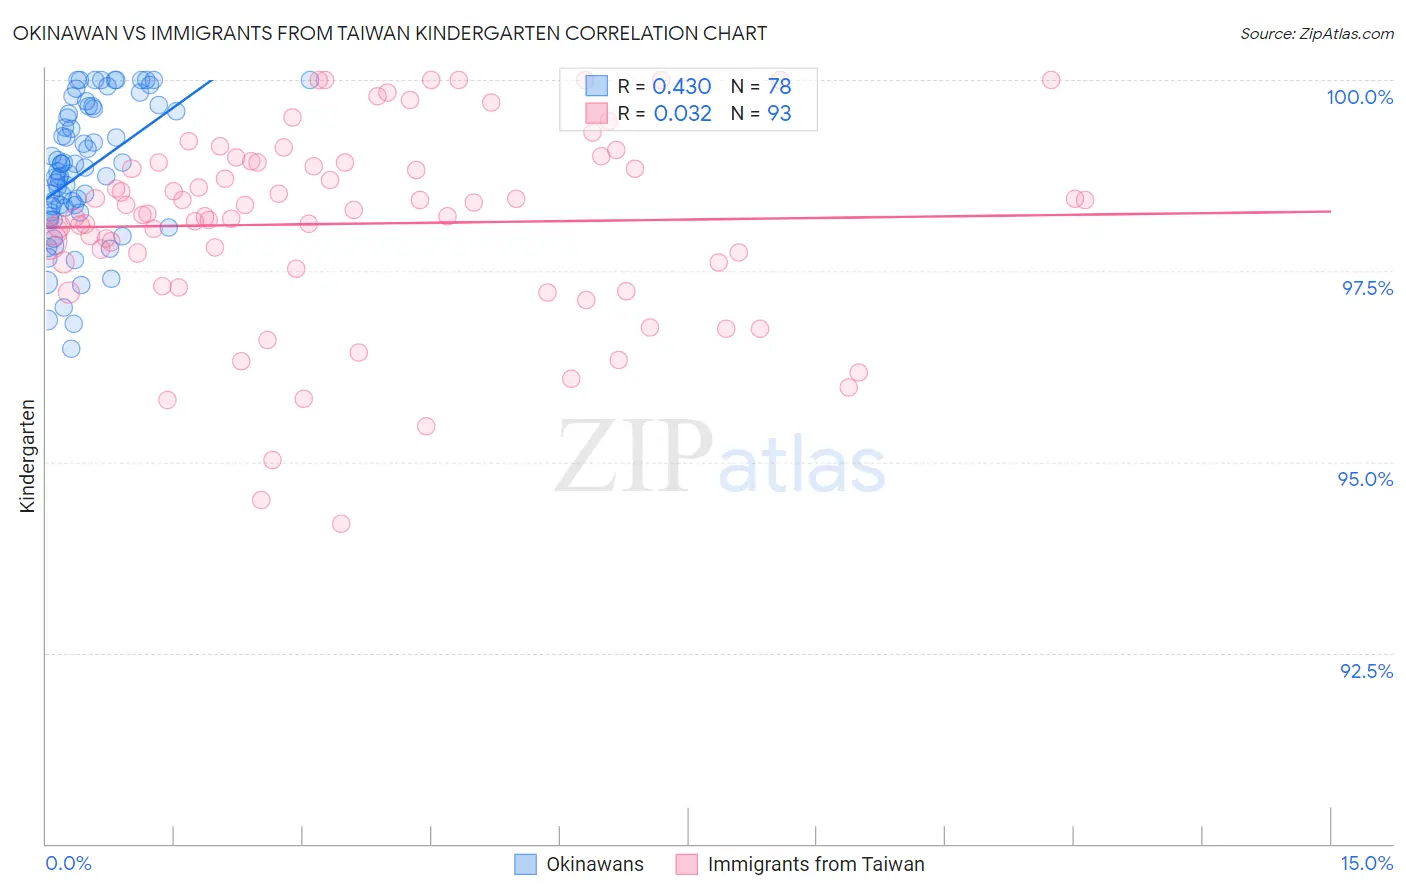
Okinawan vs Immigrants from Taiwan Kindergarten Correlation Chart
The statistical analysis conducted on geographies consisting of 73,744,614 people shows a moderate positive correlation between the proportion of Okinawans and percentage of population with at least kindergarten education in the United States with a correlation coefficient (R) of 0.430 and weighted average of 98.2%. Similarly, the statistical analysis conducted on geographies consisting of 298,069,082 people shows no correlation between the proportion of Immigrants from Taiwan and percentage of population with at least kindergarten education in the United States with a correlation coefficient (R) of 0.032 and weighted average of 97.9%, a difference of 0.28%.
Kindergarten Correlation Summary
| Measurement | Okinawan | Immigrants from Taiwan |
| Minimum | 96.5% | 94.2% |
| Maximum | 100.0% | 100.0% |
| Range | 3.5% | 5.8% |
| Mean | 98.8% | 98.1% |
| Median | 98.8% | 98.2% |
| Interquartile 25% (IQ1) | 98.3% | 97.6% |
| Interquartile 75% (IQ3) | 99.6% | 98.9% |
| Interquartile Range (IQR) | 1.4% | 1.4% |
| Standard Deviation (Sample) | 0.89% | 1.3% |
| Standard Deviation (Population) | 0.88% | 1.3% |
Similar Demographics by Kindergarten
Demographics Similar to Okinawans by Kindergarten
In terms of kindergarten, the demographic groups most similar to Okinawans are Immigrants from Zimbabwe (98.2%, a difference of 0.0%), Thai (98.2%, a difference of 0.010%), Immigrants from Japan (98.2%, a difference of 0.010%), Menominee (98.2%, a difference of 0.010%), and Syrian (98.2%, a difference of 0.010%).
| Demographics | Rating | Rank | Kindergarten |
| Immigrants | Latvia | 96.3 /100 | #113 | Exceptional 98.2% |
| Ute | 96.3 /100 | #114 | Exceptional 98.2% |
| Iranians | 96.2 /100 | #115 | Exceptional 98.2% |
| Spanish | 95.8 /100 | #116 | Exceptional 98.2% |
| Immigrants | France | 95.5 /100 | #117 | Exceptional 98.2% |
| Yugoslavians | 95.5 /100 | #118 | Exceptional 98.2% |
| Thais | 94.8 /100 | #119 | Exceptional 98.2% |
| Okinawans | 94.4 /100 | #120 | Exceptional 98.2% |
| Immigrants | Zimbabwe | 94.0 /100 | #121 | Exceptional 98.2% |
| Immigrants | Japan | 94.0 /100 | #122 | Exceptional 98.2% |
| Menominee | 93.9 /100 | #123 | Exceptional 98.2% |
| Syrians | 93.6 /100 | #124 | Exceptional 98.2% |
| Iroquois | 93.5 /100 | #125 | Exceptional 98.2% |
| Lebanese | 93.5 /100 | #126 | Exceptional 98.2% |
| Immigrants | Saudi Arabia | 93.1 /100 | #127 | Exceptional 98.1% |
Demographics Similar to Immigrants from Taiwan by Kindergarten
In terms of kindergarten, the demographic groups most similar to Immigrants from Taiwan are Black/African American (97.9%, a difference of 0.0%), Paraguayan (97.9%, a difference of 0.0%), Paiute (97.9%, a difference of 0.010%), Panamanian (97.9%, a difference of 0.010%), and Hawaiian (97.9%, a difference of 0.010%).
| Demographics | Rating | Rank | Kindergarten |
| Immigrants | Argentina | 40.7 /100 | #184 | Average 97.9% |
| Immigrants | Belarus | 39.4 /100 | #185 | Fair 97.9% |
| Pakistanis | 36.0 /100 | #186 | Fair 97.9% |
| Immigrants | Kazakhstan | 35.9 /100 | #187 | Fair 97.9% |
| Arabs | 35.4 /100 | #188 | Fair 97.9% |
| Paiute | 34.7 /100 | #189 | Fair 97.9% |
| Panamanians | 33.3 /100 | #190 | Fair 97.9% |
| Immigrants | Taiwan | 30.7 /100 | #191 | Fair 97.9% |
| Blacks/African Americans | 29.9 /100 | #192 | Fair 97.9% |
| Paraguayans | 29.6 /100 | #193 | Fair 97.9% |
| Hawaiians | 29.3 /100 | #194 | Fair 97.9% |
| Mongolians | 28.9 /100 | #195 | Fair 97.9% |
| Guamanians/Chamorros | 26.2 /100 | #196 | Fair 97.9% |
| Immigrants | Kenya | 25.5 /100 | #197 | Fair 97.9% |
| Tohono O'odham | 24.6 /100 | #198 | Fair 97.9% |