Okinawan vs Immigrants from Lebanon 10th Grade
COMPARE
Okinawan
Immigrants from Lebanon
10th Grade
10th Grade Comparison
Okinawans
Immigrants from Lebanon
94.8%
10TH GRADE
99.5/ 100
METRIC RATING
75th/ 347
METRIC RANK
93.7%
10TH GRADE
47.1/ 100
METRIC RATING
177th/ 347
METRIC RANK
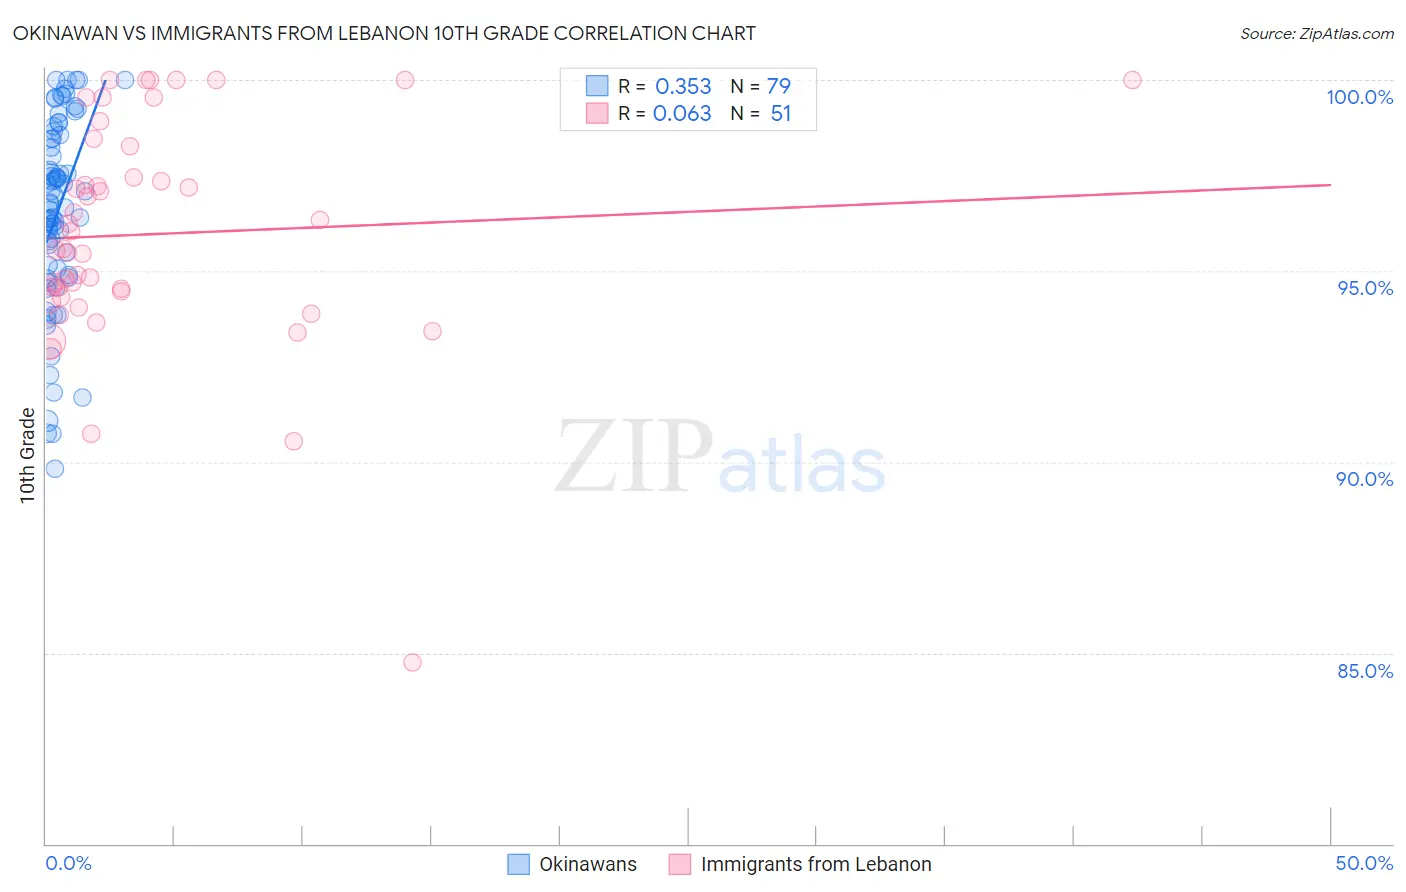
Okinawan vs Immigrants from Lebanon 10th Grade Correlation Chart
The statistical analysis conducted on geographies consisting of 73,779,368 people shows a mild positive correlation between the proportion of Okinawans and percentage of population with at least 10th grade education in the United States with a correlation coefficient (R) of 0.353 and weighted average of 94.8%. Similarly, the statistical analysis conducted on geographies consisting of 217,083,357 people shows a slight positive correlation between the proportion of Immigrants from Lebanon and percentage of population with at least 10th grade education in the United States with a correlation coefficient (R) of 0.063 and weighted average of 93.7%, a difference of 1.2%.
10th Grade Correlation Summary
| Measurement | Okinawan | Immigrants from Lebanon |
| Minimum | 89.8% | 84.7% |
| Maximum | 100.0% | 100.0% |
| Range | 10.2% | 15.3% |
| Mean | 96.6% | 96.0% |
| Median | 96.8% | 95.6% |
| Interquartile 25% (IQ1) | 95.1% | 94.3% |
| Interquartile 75% (IQ3) | 98.6% | 98.3% |
| Interquartile Range (IQR) | 3.5% | 4.0% |
| Standard Deviation (Sample) | 2.5% | 3.0% |
| Standard Deviation (Population) | 2.5% | 2.9% |
Similar Demographics by 10th Grade
Demographics Similar to Okinawans by 10th Grade
In terms of 10th grade, the demographic groups most similar to Okinawans are Romanian (94.8%, a difference of 0.010%), Immigrants from South Africa (94.8%, a difference of 0.010%), Bhutanese (94.9%, a difference of 0.030%), Canadian (94.9%, a difference of 0.030%), and Immigrants from Sweden (94.9%, a difference of 0.040%).
| Demographics | Rating | Rank | 10th Grade |
| Immigrants | Belgium | 99.7 /100 | #68 | Exceptional 94.9% |
| Immigrants | England | 99.6 /100 | #69 | Exceptional 94.9% |
| Zimbabweans | 99.6 /100 | #70 | Exceptional 94.9% |
| Alaska Natives | 99.6 /100 | #71 | Exceptional 94.9% |
| Immigrants | Sweden | 99.6 /100 | #72 | Exceptional 94.9% |
| Bhutanese | 99.6 /100 | #73 | Exceptional 94.9% |
| Canadians | 99.6 /100 | #74 | Exceptional 94.9% |
| Okinawans | 99.5 /100 | #75 | Exceptional 94.8% |
| Romanians | 99.5 /100 | #76 | Exceptional 94.8% |
| Immigrants | South Africa | 99.5 /100 | #77 | Exceptional 94.8% |
| Filipinos | 99.3 /100 | #78 | Exceptional 94.8% |
| Immigrants | Czechoslovakia | 99.2 /100 | #79 | Exceptional 94.7% |
| Immigrants | Denmark | 99.2 /100 | #80 | Exceptional 94.7% |
| Immigrants | Latvia | 99.2 /100 | #81 | Exceptional 94.7% |
| Swiss | 99.1 /100 | #82 | Exceptional 94.7% |
Demographics Similar to Immigrants from Lebanon by 10th Grade
In terms of 10th grade, the demographic groups most similar to Immigrants from Lebanon are Immigrants from Argentina (93.7%, a difference of 0.0%), Sierra Leonean (93.7%, a difference of 0.010%), Immigrants from Nepal (93.7%, a difference of 0.020%), Paraguayan (93.7%, a difference of 0.020%), and French American Indian (93.7%, a difference of 0.030%).
| Demographics | Rating | Rank | 10th Grade |
| Immigrants | Venezuela | 53.9 /100 | #170 | Average 93.8% |
| Immigrants | Albania | 52.4 /100 | #171 | Average 93.8% |
| French American Indians | 50.9 /100 | #172 | Average 93.7% |
| Spaniards | 50.3 /100 | #173 | Average 93.7% |
| Argentineans | 50.0 /100 | #174 | Average 93.7% |
| Immigrants | Nepal | 49.6 /100 | #175 | Average 93.7% |
| Immigrants | Argentina | 47.1 /100 | #176 | Average 93.7% |
| Immigrants | Lebanon | 47.1 /100 | #177 | Average 93.7% |
| Sierra Leoneans | 46.1 /100 | #178 | Average 93.7% |
| Paraguayans | 45.3 /100 | #179 | Average 93.7% |
| Blackfeet | 42.8 /100 | #180 | Average 93.7% |
| Immigrants | Northern Africa | 41.6 /100 | #181 | Average 93.7% |
| Colville | 38.8 /100 | #182 | Fair 93.6% |
| Guamanians/Chamorros | 37.1 /100 | #183 | Fair 93.6% |
| Choctaw | 36.6 /100 | #184 | Fair 93.6% |