Okinawan vs French American Indian 2nd Grade
COMPARE
Okinawan
French American Indian
2nd Grade
2nd Grade Comparison
Okinawans
French American Indians
98.1%
2ND GRADE
94.9/ 100
METRIC RATING
120th/ 347
METRIC RANK
97.9%
2ND GRADE
64.3/ 100
METRIC RATING
155th/ 347
METRIC RANK
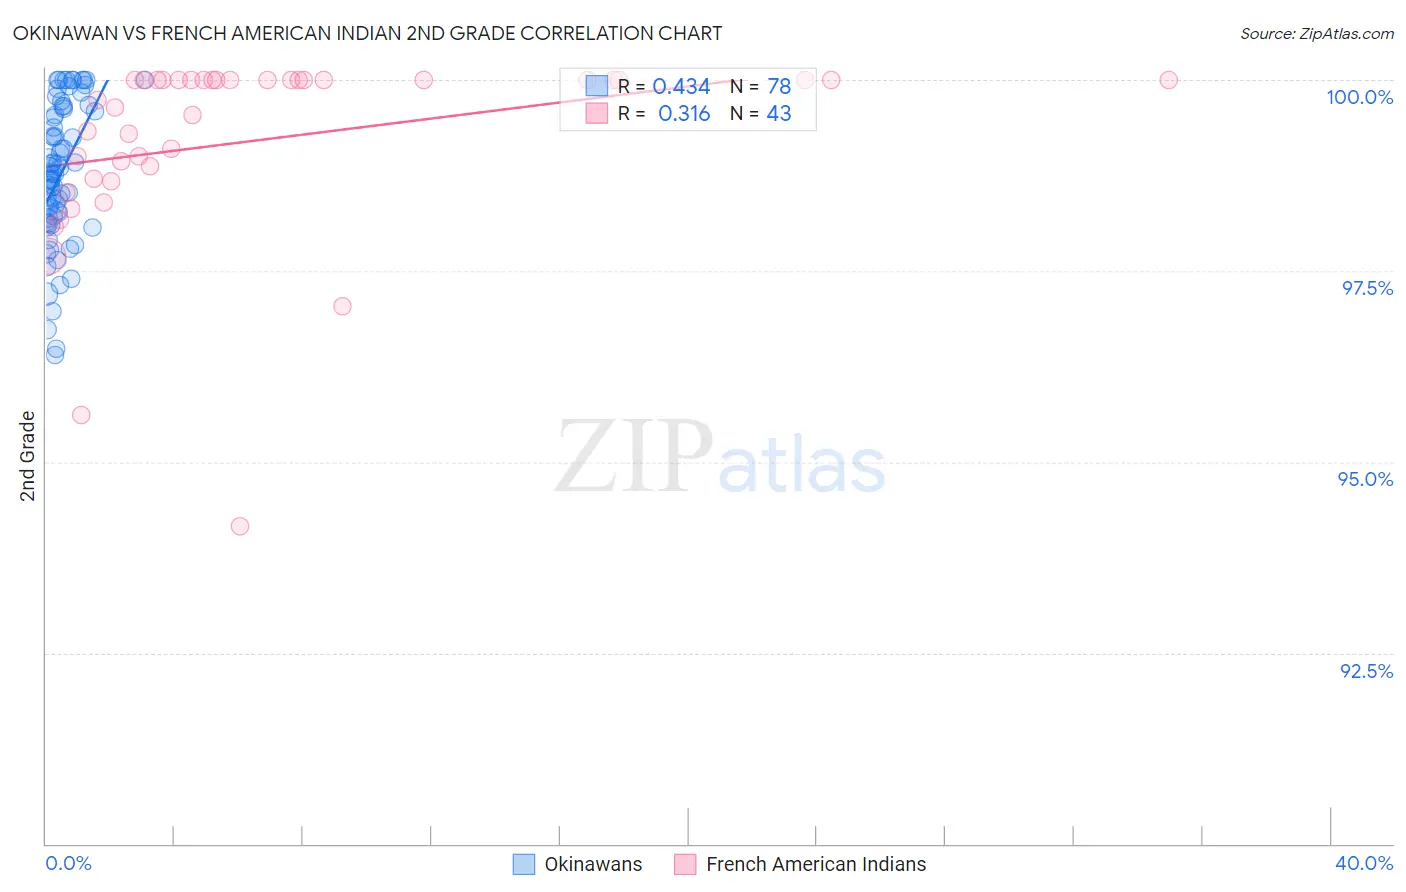
Okinawan vs French American Indian 2nd Grade Correlation Chart
The statistical analysis conducted on geographies consisting of 73,744,614 people shows a moderate positive correlation between the proportion of Okinawans and percentage of population with at least 2nd grade education in the United States with a correlation coefficient (R) of 0.434 and weighted average of 98.1%. Similarly, the statistical analysis conducted on geographies consisting of 131,974,854 people shows a mild positive correlation between the proportion of French American Indians and percentage of population with at least 2nd grade education in the United States with a correlation coefficient (R) of 0.316 and weighted average of 97.9%, a difference of 0.18%.
2nd Grade Correlation Summary
| Measurement | Okinawan | French American Indian |
| Minimum | 96.4% | 94.2% |
| Maximum | 100.0% | 100.0% |
| Range | 3.6% | 5.8% |
| Mean | 98.8% | 99.2% |
| Median | 98.8% | 100.0% |
| Interquartile 25% (IQ1) | 98.2% | 98.7% |
| Interquartile 75% (IQ3) | 99.6% | 100.0% |
| Interquartile Range (IQR) | 1.4% | 1.3% |
| Standard Deviation (Sample) | 0.92% | 1.2% |
| Standard Deviation (Population) | 0.92% | 1.2% |
Similar Demographics by 2nd Grade
Demographics Similar to Okinawans by 2nd Grade
In terms of 2nd grade, the demographic groups most similar to Okinawans are Spanish (98.1%, a difference of 0.010%), Ute (98.1%, a difference of 0.010%), Immigrants from France (98.1%, a difference of 0.010%), Thai (98.1%, a difference of 0.010%), and Immigrants from Zimbabwe (98.1%, a difference of 0.010%).
| Demographics | Rating | Rank | 2nd Grade |
| Immigrants | Norway | 96.5 /100 | #113 | Exceptional 98.1% |
| Immigrants | Latvia | 96.4 /100 | #114 | Exceptional 98.1% |
| Iranians | 95.9 /100 | #115 | Exceptional 98.1% |
| Spanish | 95.8 /100 | #116 | Exceptional 98.1% |
| Ute | 95.7 /100 | #117 | Exceptional 98.1% |
| Immigrants | France | 95.6 /100 | #118 | Exceptional 98.1% |
| Thais | 95.3 /100 | #119 | Exceptional 98.1% |
| Okinawans | 94.9 /100 | #120 | Exceptional 98.1% |
| Immigrants | Zimbabwe | 94.4 /100 | #121 | Exceptional 98.1% |
| Lebanese | 94.2 /100 | #122 | Exceptional 98.1% |
| Immigrants | Japan | 94.1 /100 | #123 | Exceptional 98.1% |
| Menominee | 94.1 /100 | #124 | Exceptional 98.1% |
| Iroquois | 94.1 /100 | #125 | Exceptional 98.1% |
| Syrians | 94.0 /100 | #126 | Exceptional 98.1% |
| Immigrants | Saudi Arabia | 93.6 /100 | #127 | Exceptional 98.1% |
Demographics Similar to French American Indians by 2nd Grade
In terms of 2nd grade, the demographic groups most similar to French American Indians are Dutch West Indian (97.9%, a difference of 0.0%), Venezuelan (97.9%, a difference of 0.0%), Immigrants from North Macedonia (97.9%, a difference of 0.010%), Immigrants from South Central Asia (97.9%, a difference of 0.010%), and Marshallese (97.9%, a difference of 0.010%).
| Demographics | Rating | Rank | 2nd Grade |
| Jordanians | 74.5 /100 | #148 | Good 98.0% |
| Apache | 74.0 /100 | #149 | Good 97.9% |
| Immigrants | Moldova | 72.9 /100 | #150 | Good 97.9% |
| Soviet Union | 70.7 /100 | #151 | Good 97.9% |
| Immigrants | North Macedonia | 68.5 /100 | #152 | Good 97.9% |
| Immigrants | South Central Asia | 68.3 /100 | #153 | Good 97.9% |
| Marshallese | 67.7 /100 | #154 | Good 97.9% |
| French American Indians | 64.3 /100 | #155 | Good 97.9% |
| Dutch West Indians | 63.8 /100 | #156 | Good 97.9% |
| Venezuelans | 63.3 /100 | #157 | Good 97.9% |
| Immigrants | Iran | 62.8 /100 | #158 | Good 97.9% |
| Comanche | 62.8 /100 | #159 | Good 97.9% |
| Immigrants | Eastern Europe | 61.1 /100 | #160 | Good 97.9% |
| Immigrants | Russia | 60.3 /100 | #161 | Good 97.9% |
| Immigrants | Italy | 60.2 /100 | #162 | Good 97.9% |