Norwegian vs Immigrants from Chile Master's Degree
COMPARE
Norwegian
Immigrants from Chile
Master's Degree
Master's Degree Comparison
Norwegians
Immigrants from Chile
14.0%
MASTER'S DEGREE
13.6/ 100
METRIC RATING
219th/ 347
METRIC RANK
16.8%
MASTER'S DEGREE
98.0/ 100
METRIC RATING
110th/ 347
METRIC RANK
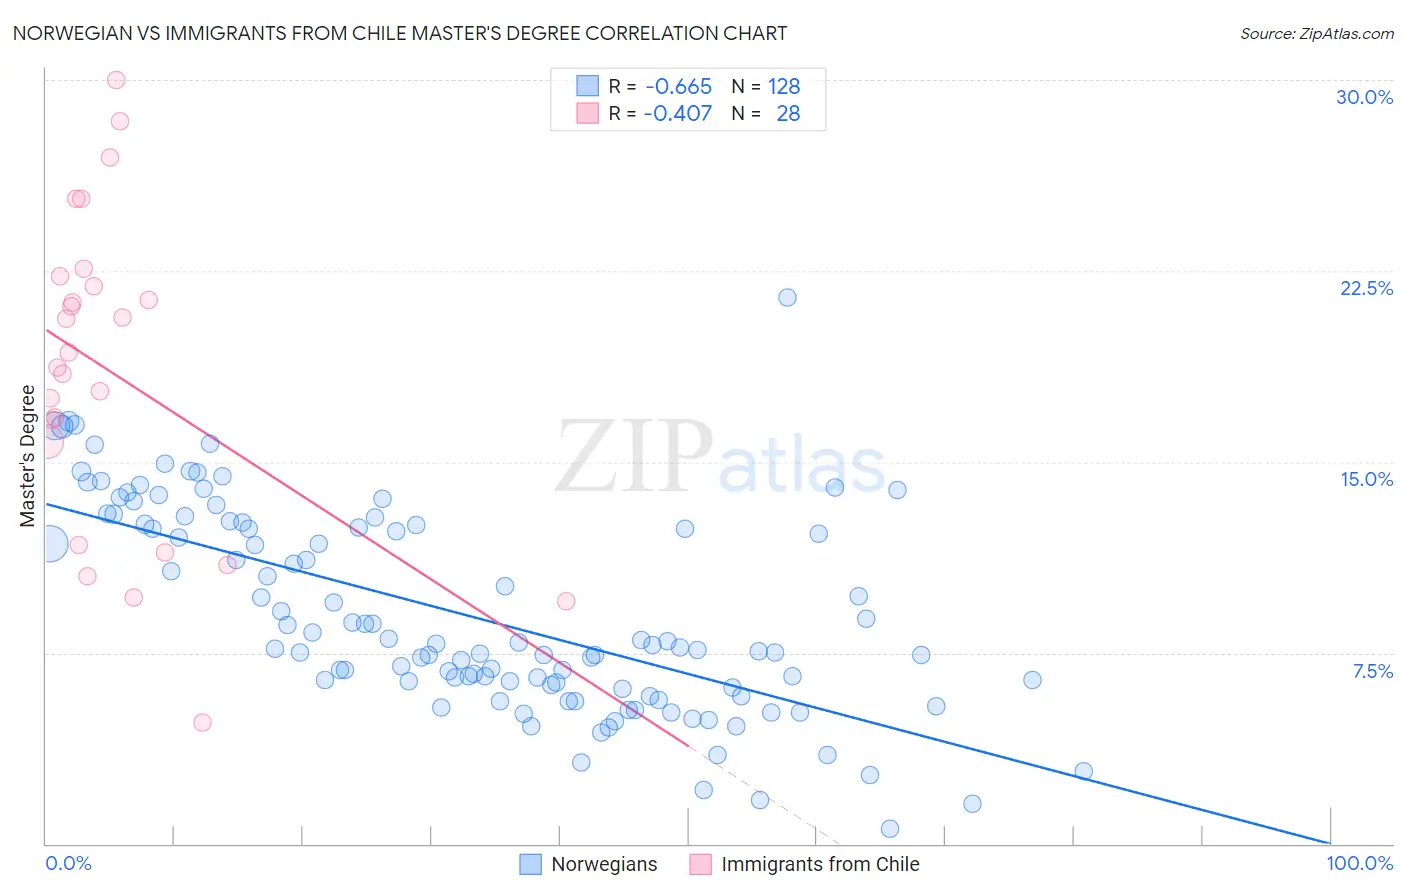
Norwegian vs Immigrants from Chile Master's Degree Correlation Chart
The statistical analysis conducted on geographies consisting of 532,895,610 people shows a significant negative correlation between the proportion of Norwegians and percentage of population with at least master's degree education in the United States with a correlation coefficient (R) of -0.665 and weighted average of 14.0%. Similarly, the statistical analysis conducted on geographies consisting of 218,626,244 people shows a moderate negative correlation between the proportion of Immigrants from Chile and percentage of population with at least master's degree education in the United States with a correlation coefficient (R) of -0.407 and weighted average of 16.8%, a difference of 19.5%.
Master's Degree Correlation Summary
| Measurement | Norwegian | Immigrants from Chile |
| Minimum | 0.57% | 4.8% |
| Maximum | 21.5% | 30.0% |
| Range | 20.9% | 25.2% |
| Mean | 9.0% | 18.5% |
| Median | 7.8% | 19.0% |
| Interquartile 25% (IQ1) | 6.2% | 13.8% |
| Interquartile 75% (IQ3) | 12.5% | 22.1% |
| Interquartile Range (IQR) | 6.3% | 8.3% |
| Standard Deviation (Sample) | 4.0% | 6.2% |
| Standard Deviation (Population) | 4.0% | 6.1% |
Similar Demographics by Master's Degree
Demographics Similar to Norwegians by Master's Degree
In terms of master's degree, the demographic groups most similar to Norwegians are German (14.0%, a difference of 0.15%), Korean (14.0%, a difference of 0.29%), Ecuadorian (14.0%, a difference of 0.32%), French Canadian (14.1%, a difference of 0.35%), and Immigrants from South Eastern Asia (14.0%, a difference of 0.52%).
| Demographics | Rating | Rank | Master's Degree |
| Spanish | 17.8 /100 | #212 | Poor 14.2% |
| Immigrants | Thailand | 17.0 /100 | #213 | Poor 14.2% |
| Finns | 16.9 /100 | #214 | Poor 14.2% |
| Immigrants | Vietnam | 16.1 /100 | #215 | Poor 14.1% |
| Immigrants | Somalia | 15.8 /100 | #216 | Poor 14.1% |
| Immigrants | Trinidad and Tobago | 15.8 /100 | #217 | Poor 14.1% |
| French Canadians | 14.9 /100 | #218 | Poor 14.1% |
| Norwegians | 13.6 /100 | #219 | Poor 14.0% |
| Germans | 13.1 /100 | #220 | Poor 14.0% |
| Koreans | 12.7 /100 | #221 | Poor 14.0% |
| Ecuadorians | 12.6 /100 | #222 | Poor 14.0% |
| Immigrants | South Eastern Asia | 11.9 /100 | #223 | Poor 14.0% |
| Immigrants | Grenada | 11.8 /100 | #224 | Poor 14.0% |
| Portuguese | 11.2 /100 | #225 | Poor 13.9% |
| Immigrants | St. Vincent and the Grenadines | 11.0 /100 | #226 | Poor 13.9% |
Demographics Similar to Immigrants from Chile by Master's Degree
In terms of master's degree, the demographic groups most similar to Immigrants from Chile are Moroccan (16.8%, a difference of 0.030%), Sierra Leonean (16.8%, a difference of 0.050%), Armenian (16.8%, a difference of 0.080%), Immigrants from Albania (16.8%, a difference of 0.17%), and Austrian (16.7%, a difference of 0.27%).
| Demographics | Rating | Rank | Master's Degree |
| Alsatians | 98.4 /100 | #103 | Exceptional 16.9% |
| Ukrainians | 98.3 /100 | #104 | Exceptional 16.9% |
| Syrians | 98.3 /100 | #105 | Exceptional 16.8% |
| Immigrants | Albania | 98.1 /100 | #106 | Exceptional 16.8% |
| Armenians | 98.0 /100 | #107 | Exceptional 16.8% |
| Sierra Leoneans | 98.0 /100 | #108 | Exceptional 16.8% |
| Moroccans | 98.0 /100 | #109 | Exceptional 16.8% |
| Immigrants | Chile | 98.0 /100 | #110 | Exceptional 16.8% |
| Austrians | 97.8 /100 | #111 | Exceptional 16.7% |
| Macedonians | 97.7 /100 | #112 | Exceptional 16.7% |
| Arabs | 97.7 /100 | #113 | Exceptional 16.7% |
| Northern Europeans | 97.6 /100 | #114 | Exceptional 16.7% |
| Immigrants | Uganda | 97.3 /100 | #115 | Exceptional 16.6% |
| Immigrants | Southern Europe | 97.2 /100 | #116 | Exceptional 16.6% |
| Immigrants | Moldova | 97.2 /100 | #117 | Exceptional 16.6% |