Norwegian vs Immigrants from Cambodia Bachelor's Degree
COMPARE
Norwegian
Immigrants from Cambodia
Bachelor's Degree
Bachelor's Degree Comparison
Norwegians
Immigrants from Cambodia
37.5%
BACHELOR'S DEGREE
40.4/ 100
METRIC RATING
186th/ 347
METRIC RANK
34.2%
BACHELOR'S DEGREE
1.9/ 100
METRIC RATING
241st/ 347
METRIC RANK
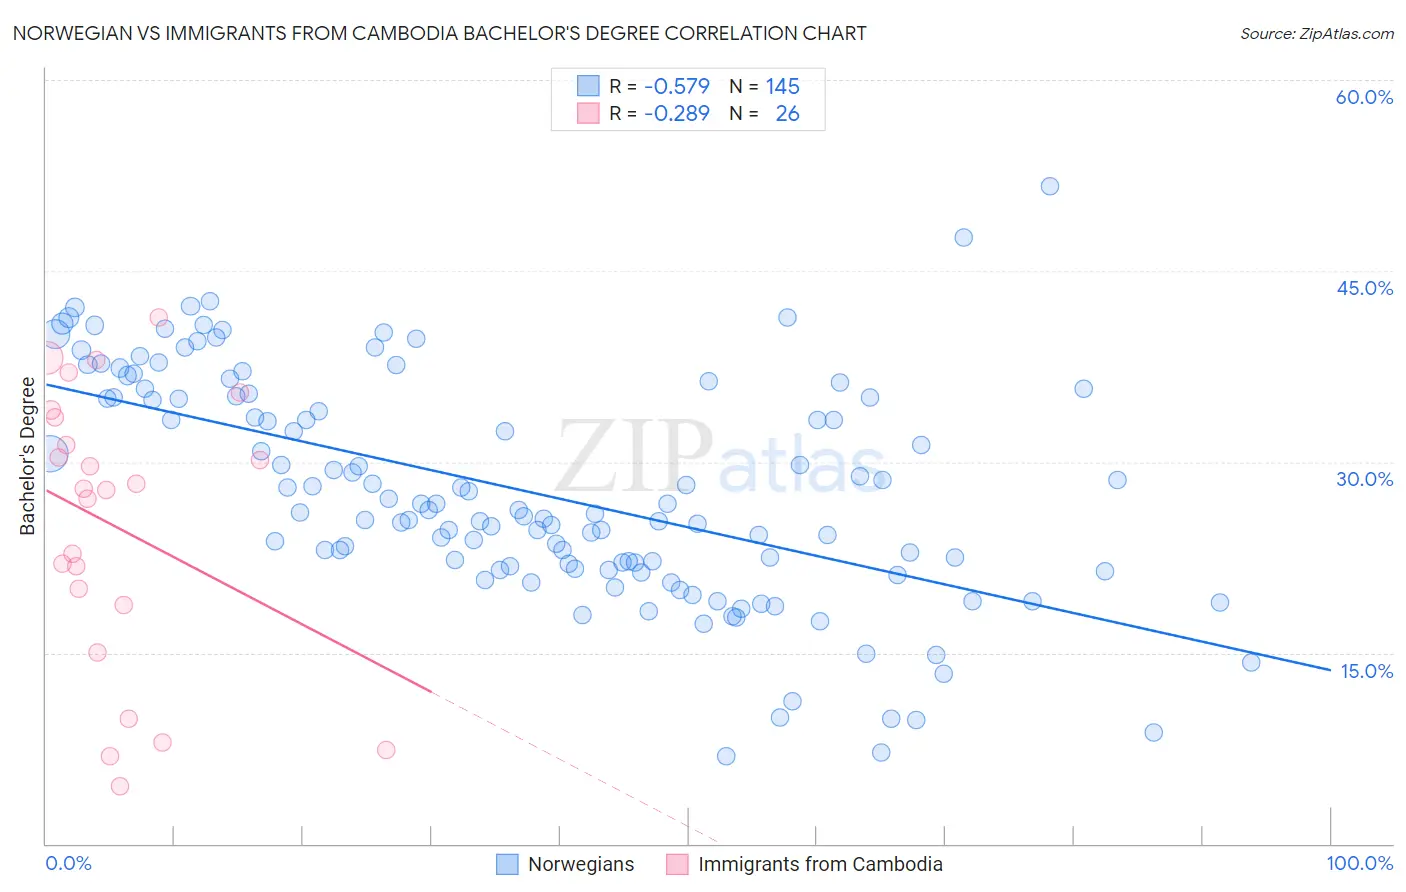
Norwegian vs Immigrants from Cambodia Bachelor's Degree Correlation Chart
The statistical analysis conducted on geographies consisting of 533,300,723 people shows a substantial negative correlation between the proportion of Norwegians and percentage of population with at least bachelor's degree education in the United States with a correlation coefficient (R) of -0.579 and weighted average of 37.5%. Similarly, the statistical analysis conducted on geographies consisting of 205,152,160 people shows a weak negative correlation between the proportion of Immigrants from Cambodia and percentage of population with at least bachelor's degree education in the United States with a correlation coefficient (R) of -0.289 and weighted average of 34.2%, a difference of 9.6%.
Bachelor's Degree Correlation Summary
| Measurement | Norwegian | Immigrants from Cambodia |
| Minimum | 6.9% | 4.5% |
| Maximum | 51.7% | 41.4% |
| Range | 44.8% | 36.9% |
| Mean | 27.7% | 24.9% |
| Median | 26.2% | 27.9% |
| Interquartile 25% (IQ1) | 21.7% | 18.8% |
| Interquartile 75% (IQ3) | 35.1% | 33.5% |
| Interquartile Range (IQR) | 13.4% | 14.7% |
| Standard Deviation (Sample) | 8.9% | 10.8% |
| Standard Deviation (Population) | 8.8% | 10.6% |
Similar Demographics by Bachelor's Degree
Demographics Similar to Norwegians by Bachelor's Degree
In terms of bachelor's degree, the demographic groups most similar to Norwegians are English (37.4%, a difference of 0.070%), Immigrants from Peru (37.5%, a difference of 0.10%), Scandinavian (37.5%, a difference of 0.14%), Senegalese (37.5%, a difference of 0.18%), and Immigrants from Bosnia and Herzegovina (37.6%, a difference of 0.31%).
| Demographics | Rating | Rank | Bachelor's Degree |
| Immigrants | Colombia | 45.4 /100 | #179 | Average 37.7% |
| Irish | 44.3 /100 | #180 | Average 37.6% |
| Immigrants | Senegal | 43.8 /100 | #181 | Average 37.6% |
| Immigrants | Bosnia and Herzegovina | 43.4 /100 | #182 | Average 37.6% |
| Senegalese | 42.2 /100 | #183 | Average 37.5% |
| Scandinavians | 41.7 /100 | #184 | Average 37.5% |
| Immigrants | Peru | 41.3 /100 | #185 | Average 37.5% |
| Norwegians | 40.4 /100 | #186 | Average 37.5% |
| English | 39.7 /100 | #187 | Fair 37.4% |
| Immigrants | Oceania | 37.3 /100 | #188 | Fair 37.3% |
| Slovaks | 36.9 /100 | #189 | Fair 37.3% |
| Swiss | 34.1 /100 | #190 | Fair 37.2% |
| Nigerians | 33.9 /100 | #191 | Fair 37.2% |
| Immigrants | Vietnam | 32.1 /100 | #192 | Fair 37.1% |
| Yugoslavians | 31.5 /100 | #193 | Fair 37.1% |
Demographics Similar to Immigrants from Cambodia by Bachelor's Degree
In terms of bachelor's degree, the demographic groups most similar to Immigrants from Cambodia are Nonimmigrants (34.2%, a difference of 0.060%), Tongan (34.3%, a difference of 0.26%), Immigrants from Guyana (33.9%, a difference of 0.71%), British West Indian (34.5%, a difference of 0.80%), and Guyanese (34.5%, a difference of 0.82%).
| Demographics | Rating | Rank | Bachelor's Degree |
| Guamanians/Chamorros | 3.0 /100 | #234 | Tragic 34.6% |
| Immigrants | West Indies | 2.9 /100 | #235 | Tragic 34.6% |
| Liberians | 2.8 /100 | #236 | Tragic 34.6% |
| Tlingit-Haida | 2.8 /100 | #237 | Tragic 34.6% |
| Guyanese | 2.5 /100 | #238 | Tragic 34.5% |
| British West Indians | 2.5 /100 | #239 | Tragic 34.5% |
| Tongans | 2.0 /100 | #240 | Tragic 34.3% |
| Immigrants | Cambodia | 1.9 /100 | #241 | Tragic 34.2% |
| Immigrants | Nonimmigrants | 1.8 /100 | #242 | Tragic 34.2% |
| Immigrants | Guyana | 1.4 /100 | #243 | Tragic 33.9% |
| Delaware | 1.2 /100 | #244 | Tragic 33.8% |
| Immigrants | Fiji | 1.2 /100 | #245 | Tragic 33.7% |
| Jamaicans | 1.0 /100 | #246 | Tragic 33.6% |
| Immigrants | Congo | 1.0 /100 | #247 | Tragic 33.6% |
| Cree | 1.0 /100 | #248 | Tragic 33.6% |