Norwegian vs French American Indian 11th Grade
COMPARE
Norwegian
French American Indian
11th Grade
11th Grade Comparison
Norwegians
French American Indians
95.2%
11TH GRADE
100.0/ 100
METRIC RATING
1st/ 347
METRIC RANK
92.3%
11TH GRADE
30.8/ 100
METRIC RATING
191st/ 347
METRIC RANK
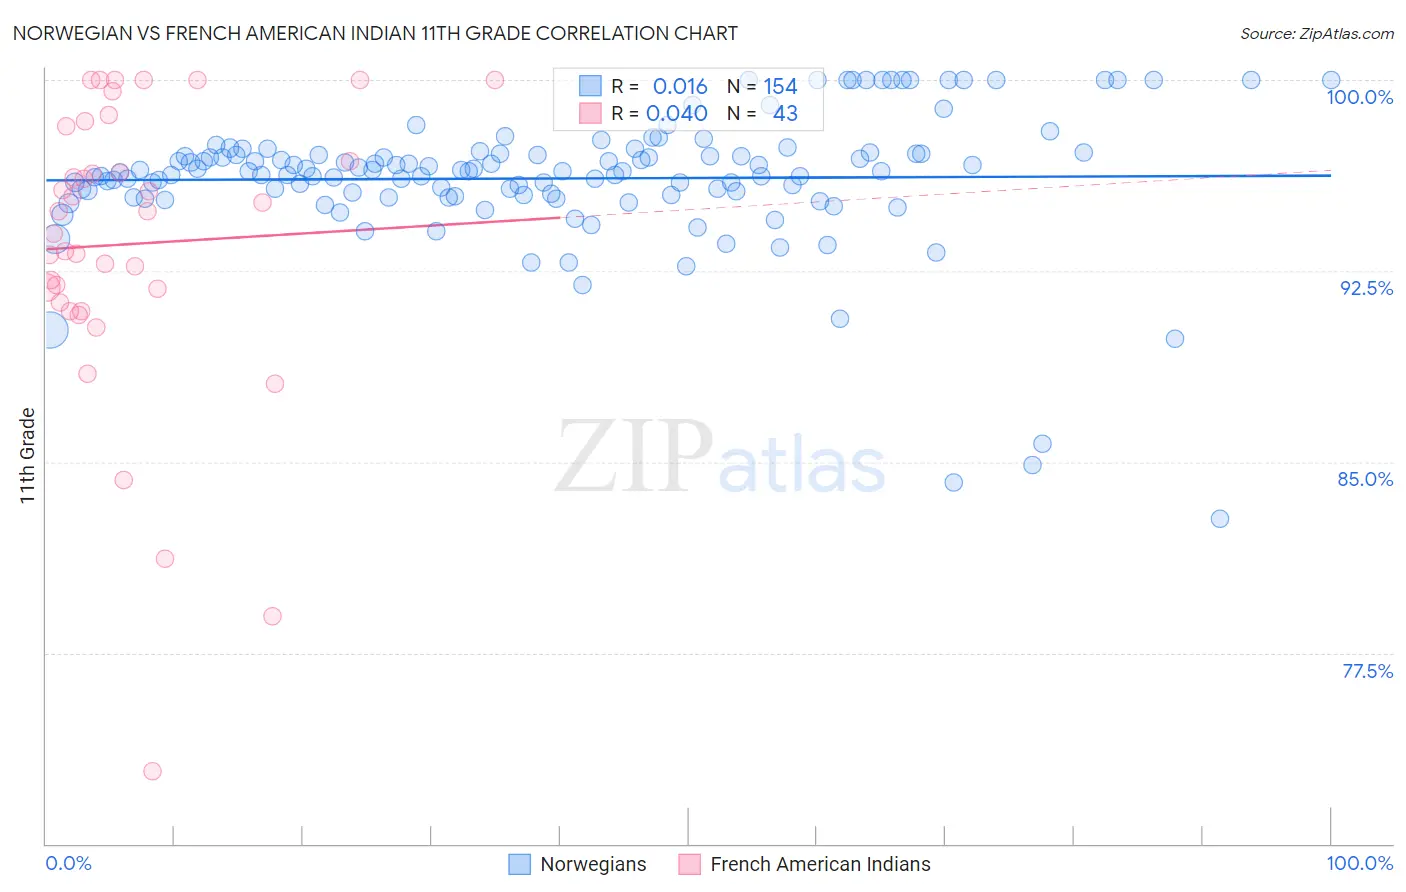
Norwegian vs French American Indian 11th Grade Correlation Chart
The statistical analysis conducted on geographies consisting of 533,395,805 people shows no correlation between the proportion of Norwegians and percentage of population with at least 11th grade education in the United States with a correlation coefficient (R) of 0.016 and weighted average of 95.2%. Similarly, the statistical analysis conducted on geographies consisting of 131,976,269 people shows no correlation between the proportion of French American Indians and percentage of population with at least 11th grade education in the United States with a correlation coefficient (R) of 0.040 and weighted average of 92.3%, a difference of 3.1%.
11th Grade Correlation Summary
| Measurement | Norwegian | French American Indian |
| Minimum | 82.8% | 72.9% |
| Maximum | 100.0% | 100.0% |
| Range | 17.2% | 27.1% |
| Mean | 96.1% | 93.6% |
| Median | 96.4% | 94.8% |
| Interquartile 25% (IQ1) | 95.5% | 91.3% |
| Interquartile 75% (IQ3) | 97.1% | 98.2% |
| Interquartile Range (IQR) | 1.6% | 6.9% |
| Standard Deviation (Sample) | 2.7% | 5.9% |
| Standard Deviation (Population) | 2.7% | 5.8% |
Similar Demographics by 11th Grade
Demographics Similar to Norwegians by 11th Grade
In terms of 11th grade, the demographic groups most similar to Norwegians are Swedish (94.9%, a difference of 0.28%), Slovene (94.9%, a difference of 0.30%), Slovak (94.9%, a difference of 0.32%), Carpatho Rusyn (94.8%, a difference of 0.38%), and Lithuanian (94.8%, a difference of 0.43%).
| Demographics | Rating | Rank | 11th Grade |
| Norwegians | 100.0 /100 | #1 | Exceptional 95.2% |
| Swedes | 100.0 /100 | #2 | Exceptional 94.9% |
| Slovenes | 100.0 /100 | #3 | Exceptional 94.9% |
| Slovaks | 100.0 /100 | #4 | Exceptional 94.9% |
| Carpatho Rusyns | 100.0 /100 | #5 | Exceptional 94.8% |
| Lithuanians | 100.0 /100 | #6 | Exceptional 94.8% |
| Poles | 100.0 /100 | #7 | Exceptional 94.8% |
| Croatians | 100.0 /100 | #8 | Exceptional 94.7% |
| Danes | 100.0 /100 | #9 | Exceptional 94.7% |
| Finns | 100.0 /100 | #10 | Exceptional 94.7% |
| Germans | 100.0 /100 | #11 | Exceptional 94.7% |
| Latvians | 100.0 /100 | #12 | Exceptional 94.7% |
| Chinese | 100.0 /100 | #13 | Exceptional 94.6% |
| Eastern Europeans | 100.0 /100 | #14 | Exceptional 94.6% |
| Bulgarians | 100.0 /100 | #15 | Exceptional 94.5% |
Demographics Similar to French American Indians by 11th Grade
In terms of 11th grade, the demographic groups most similar to French American Indians are Immigrants from Syria (92.3%, a difference of 0.0%), Chickasaw (92.3%, a difference of 0.010%), Moroccan (92.3%, a difference of 0.020%), Immigrants from Indonesia (92.4%, a difference of 0.030%), and Immigrants from Chile (92.4%, a difference of 0.030%).
| Demographics | Rating | Rank | 11th Grade |
| Immigrants | Asia | 37.4 /100 | #184 | Fair 92.4% |
| Immigrants | Nepal | 36.4 /100 | #185 | Fair 92.4% |
| Arapaho | 35.1 /100 | #186 | Fair 92.4% |
| Immigrants | Western Asia | 35.0 /100 | #187 | Fair 92.4% |
| Immigrants | Indonesia | 33.7 /100 | #188 | Fair 92.4% |
| Immigrants | Chile | 33.3 /100 | #189 | Fair 92.4% |
| Chickasaw | 31.4 /100 | #190 | Fair 92.3% |
| French American Indians | 30.8 /100 | #191 | Fair 92.3% |
| Immigrants | Syria | 30.4 /100 | #192 | Fair 92.3% |
| Moroccans | 28.7 /100 | #193 | Fair 92.3% |
| Sioux | 28.5 /100 | #194 | Fair 92.3% |
| Liberians | 26.8 /100 | #195 | Fair 92.3% |
| Panamanians | 26.4 /100 | #196 | Fair 92.3% |
| Marshallese | 26.0 /100 | #197 | Fair 92.3% |
| Hawaiians | 25.5 /100 | #198 | Fair 92.3% |