Norwegian vs Alaska Native College, 1 year or more
COMPARE
Norwegian
Alaska Native
College, 1 year or more
College, 1 year or more Comparison
Norwegians
Alaska Natives
61.7%
COLLEGE, 1 YEAR OR MORE
94.5/ 100
METRIC RATING
115th/ 347
METRIC RANK
53.4%
COLLEGE, 1 YEAR OR MORE
0.0/ 100
METRIC RATING
288th/ 347
METRIC RANK
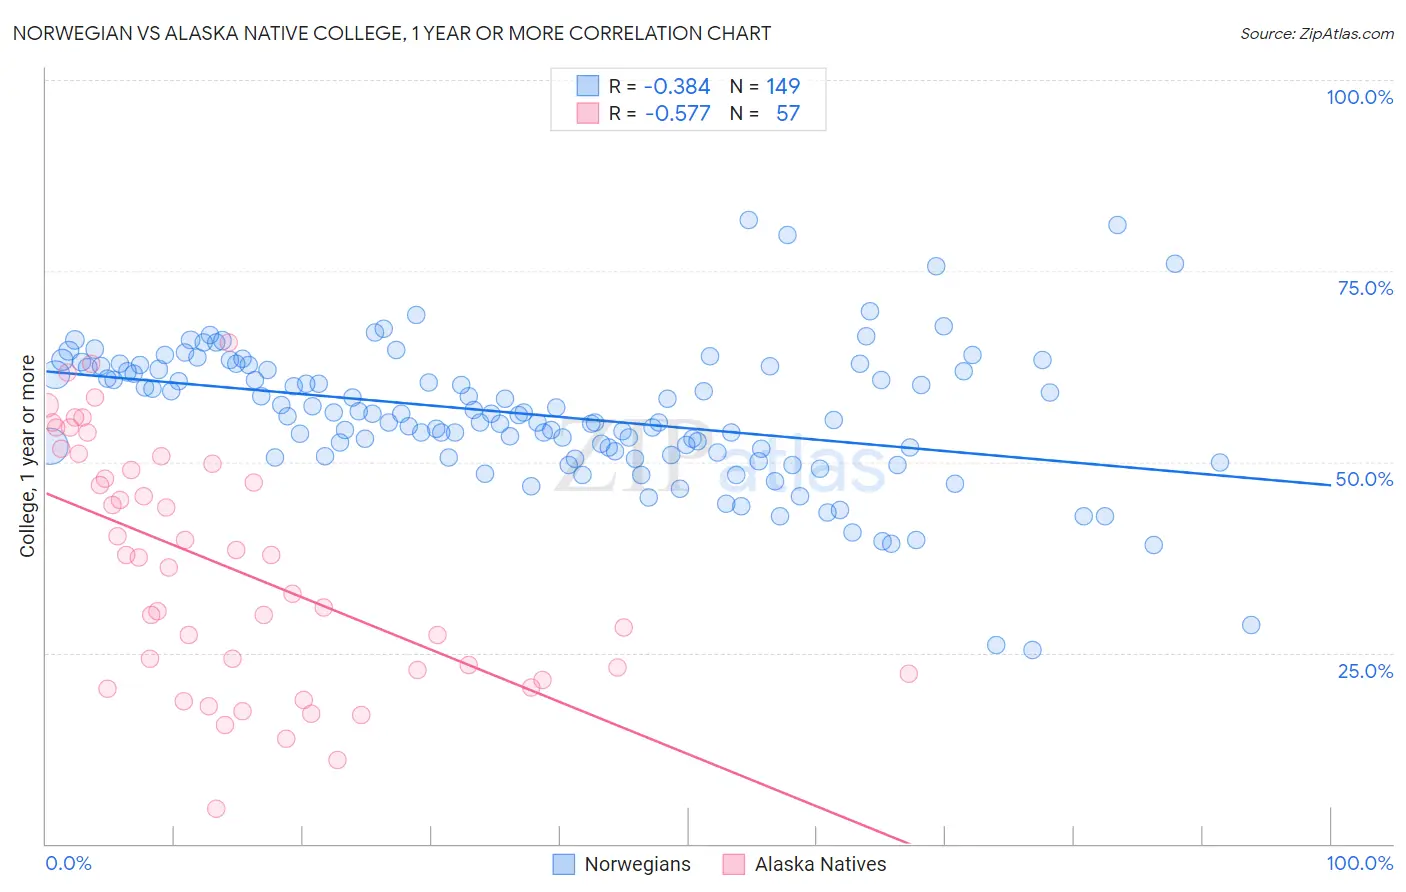
Norwegian vs Alaska Native College, 1 year or more Correlation Chart
The statistical analysis conducted on geographies consisting of 533,389,627 people shows a mild negative correlation between the proportion of Norwegians and percentage of population with at least college, 1 year or more education in the United States with a correlation coefficient (R) of -0.384 and weighted average of 61.7%. Similarly, the statistical analysis conducted on geographies consisting of 76,778,531 people shows a substantial negative correlation between the proportion of Alaska Natives and percentage of population with at least college, 1 year or more education in the United States with a correlation coefficient (R) of -0.577 and weighted average of 53.4%, a difference of 15.4%.
College, 1 year or more Correlation Summary
| Measurement | Norwegian | Alaska Native |
| Minimum | 25.4% | 4.6% |
| Maximum | 81.7% | 65.6% |
| Range | 56.3% | 61.0% |
| Mean | 56.1% | 36.3% |
| Median | 56.3% | 37.5% |
| Interquartile 25% (IQ1) | 51.0% | 22.5% |
| Interquartile 75% (IQ3) | 62.5% | 50.3% |
| Interquartile Range (IQR) | 11.4% | 27.8% |
| Standard Deviation (Sample) | 9.1% | 15.6% |
| Standard Deviation (Population) | 9.1% | 15.5% |
Similar Demographics by College, 1 year or more
Demographics Similar to Norwegians by College, 1 year or more
In terms of college, 1 year or more, the demographic groups most similar to Norwegians are Danish (61.7%, a difference of 0.070%), Lebanese (61.6%, a difference of 0.10%), Arab (61.6%, a difference of 0.14%), Immigrants from Brazil (61.6%, a difference of 0.15%), and Ukrainian (61.8%, a difference of 0.18%).
| Demographics | Rating | Rank | College, 1 year or more |
| Syrians | 95.7 /100 | #108 | Exceptional 61.9% |
| Immigrants | Northern Africa | 95.7 /100 | #109 | Exceptional 61.9% |
| Europeans | 95.6 /100 | #110 | Exceptional 61.8% |
| Macedonians | 95.6 /100 | #111 | Exceptional 61.8% |
| Austrians | 95.4 /100 | #112 | Exceptional 61.8% |
| Ukrainians | 95.2 /100 | #113 | Exceptional 61.8% |
| Danes | 94.8 /100 | #114 | Exceptional 61.7% |
| Norwegians | 94.5 /100 | #115 | Exceptional 61.7% |
| Lebanese | 94.1 /100 | #116 | Exceptional 61.6% |
| Arabs | 93.9 /100 | #117 | Exceptional 61.6% |
| Immigrants | Brazil | 93.9 /100 | #118 | Exceptional 61.6% |
| Assyrians/Chaldeans/Syriacs | 93.3 /100 | #119 | Exceptional 61.5% |
| Pakistanis | 93.2 /100 | #120 | Exceptional 61.5% |
| Immigrants | Jordan | 92.7 /100 | #121 | Exceptional 61.4% |
| Immigrants | Chile | 92.3 /100 | #122 | Exceptional 61.4% |
Demographics Similar to Alaska Natives by College, 1 year or more
In terms of college, 1 year or more, the demographic groups most similar to Alaska Natives are Immigrants from Ecuador (53.4%, a difference of 0.0%), Alaskan Athabascan (53.4%, a difference of 0.020%), Cuban (53.4%, a difference of 0.070%), Immigrants from Belize (53.5%, a difference of 0.17%), and Central American Indian (53.5%, a difference of 0.20%).
| Demographics | Rating | Rank | College, 1 year or more |
| Colville | 0.1 /100 | #281 | Tragic 54.1% |
| Guyanese | 0.1 /100 | #282 | Tragic 54.1% |
| Nicaraguans | 0.1 /100 | #283 | Tragic 53.9% |
| Ute | 0.1 /100 | #284 | Tragic 53.8% |
| Immigrants | Guyana | 0.1 /100 | #285 | Tragic 53.5% |
| Central American Indians | 0.1 /100 | #286 | Tragic 53.5% |
| Immigrants | Belize | 0.1 /100 | #287 | Tragic 53.5% |
| Alaska Natives | 0.0 /100 | #288 | Tragic 53.4% |
| Immigrants | Ecuador | 0.0 /100 | #289 | Tragic 53.4% |
| Alaskan Athabascans | 0.0 /100 | #290 | Tragic 53.4% |
| Cubans | 0.0 /100 | #291 | Tragic 53.4% |
| Chickasaw | 0.0 /100 | #292 | Tragic 53.3% |
| Blacks/African Americans | 0.0 /100 | #293 | Tragic 53.3% |
| Cherokee | 0.0 /100 | #294 | Tragic 53.2% |
| Yaqui | 0.0 /100 | #295 | Tragic 53.2% |