Northern European vs Iranian Master's Degree
COMPARE
Northern European
Iranian
Master's Degree
Master's Degree Comparison
Northern Europeans
Iranians
16.7%
MASTER'S DEGREE
97.6/ 100
METRIC RATING
114th/ 347
METRIC RANK
22.3%
MASTER'S DEGREE
100.0/ 100
METRIC RATING
7th/ 347
METRIC RANK
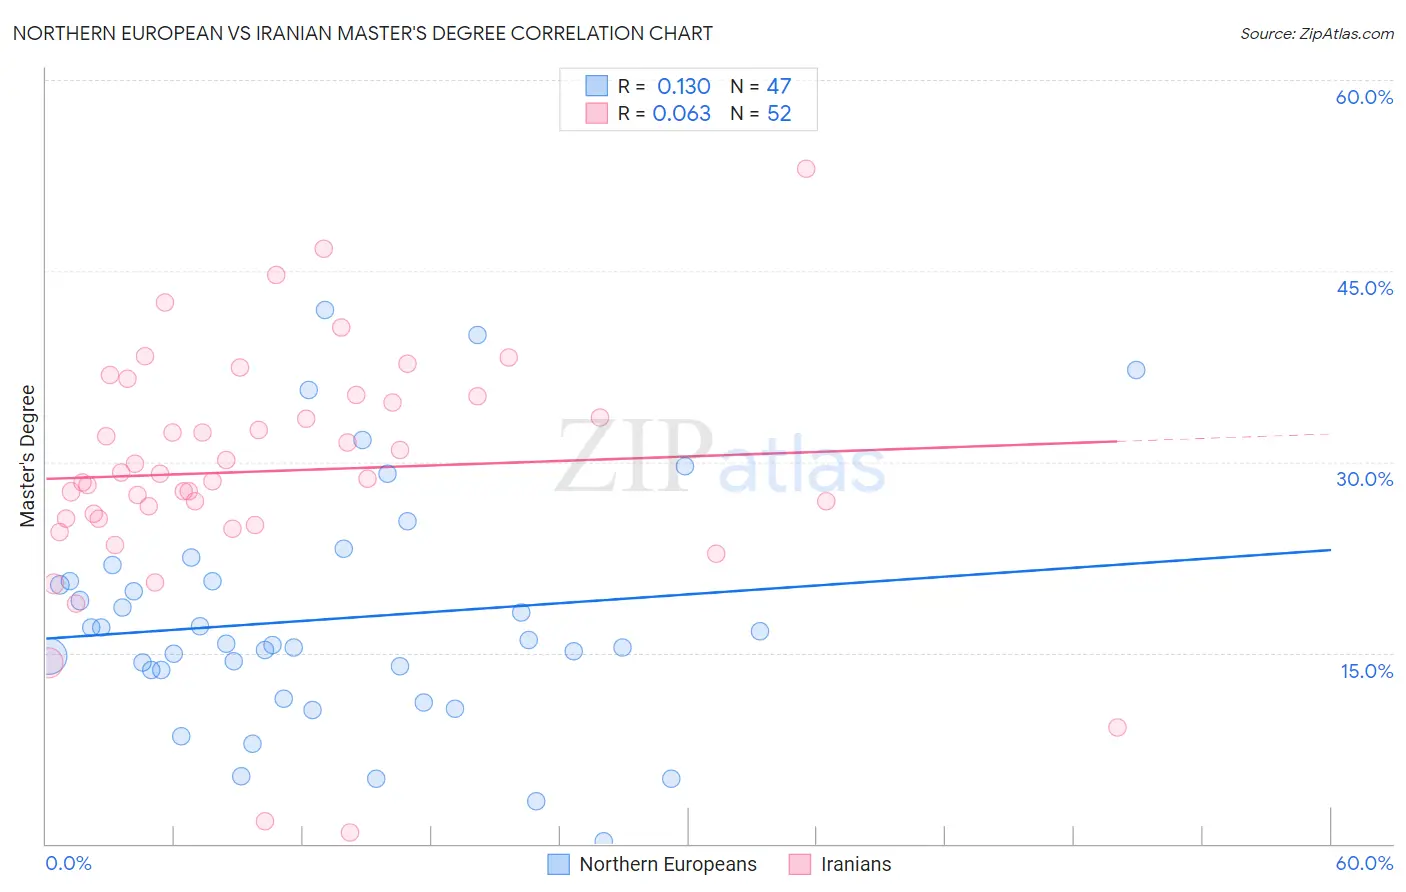
Northern European vs Iranian Master's Degree Correlation Chart
The statistical analysis conducted on geographies consisting of 406,008,564 people shows a poor positive correlation between the proportion of Northern Europeans and percentage of population with at least master's degree education in the United States with a correlation coefficient (R) of 0.130 and weighted average of 16.7%. Similarly, the statistical analysis conducted on geographies consisting of 316,817,608 people shows a slight positive correlation between the proportion of Iranians and percentage of population with at least master's degree education in the United States with a correlation coefficient (R) of 0.063 and weighted average of 22.3%, a difference of 33.4%.
Master's Degree Correlation Summary
| Measurement | Northern European | Iranian |
| Minimum | 0.22% | 0.89% |
| Maximum | 41.9% | 53.0% |
| Range | 41.7% | 52.1% |
| Mean | 17.7% | 29.3% |
| Median | 15.7% | 28.9% |
| Interquartile 25% (IQ1) | 13.7% | 25.5% |
| Interquartile 75% (IQ3) | 20.7% | 34.9% |
| Interquartile Range (IQR) | 7.0% | 9.4% |
| Standard Deviation (Sample) | 9.2% | 9.6% |
| Standard Deviation (Population) | 9.1% | 9.5% |
Similar Demographics by Master's Degree
Demographics Similar to Northern Europeans by Master's Degree
In terms of master's degree, the demographic groups most similar to Northern Europeans are Arab (16.7%, a difference of 0.070%), Macedonian (16.7%, a difference of 0.080%), Austrian (16.7%, a difference of 0.22%), Immigrants from Uganda (16.6%, a difference of 0.30%), and Immigrants from Southern Europe (16.6%, a difference of 0.42%).
| Demographics | Rating | Rank | Master's Degree |
| Armenians | 98.0 /100 | #107 | Exceptional 16.8% |
| Sierra Leoneans | 98.0 /100 | #108 | Exceptional 16.8% |
| Moroccans | 98.0 /100 | #109 | Exceptional 16.8% |
| Immigrants | Chile | 98.0 /100 | #110 | Exceptional 16.8% |
| Austrians | 97.8 /100 | #111 | Exceptional 16.7% |
| Macedonians | 97.7 /100 | #112 | Exceptional 16.7% |
| Arabs | 97.7 /100 | #113 | Exceptional 16.7% |
| Northern Europeans | 97.6 /100 | #114 | Exceptional 16.7% |
| Immigrants | Uganda | 97.3 /100 | #115 | Exceptional 16.6% |
| Immigrants | Southern Europe | 97.2 /100 | #116 | Exceptional 16.6% |
| Immigrants | Moldova | 97.2 /100 | #117 | Exceptional 16.6% |
| Brazilians | 96.8 /100 | #118 | Exceptional 16.5% |
| Jordanians | 96.5 /100 | #119 | Exceptional 16.5% |
| Lebanese | 96.4 /100 | #120 | Exceptional 16.5% |
| Afghans | 96.2 /100 | #121 | Exceptional 16.5% |
Demographics Similar to Iranians by Master's Degree
In terms of master's degree, the demographic groups most similar to Iranians are Immigrants from India (22.3%, a difference of 0.21%), Immigrants from Taiwan (22.5%, a difference of 0.88%), Immigrants from Israel (22.6%, a difference of 1.7%), Okinawan (22.6%, a difference of 1.7%), and Cypriot (21.8%, a difference of 2.2%).
| Demographics | Rating | Rank | Master's Degree |
| Immigrants | Singapore | 100.0 /100 | #1 | Exceptional 23.4% |
| Filipinos | 100.0 /100 | #2 | Exceptional 23.4% |
| Immigrants | Israel | 100.0 /100 | #3 | Exceptional 22.6% |
| Okinawans | 100.0 /100 | #4 | Exceptional 22.6% |
| Immigrants | Taiwan | 100.0 /100 | #5 | Exceptional 22.5% |
| Immigrants | India | 100.0 /100 | #6 | Exceptional 22.3% |
| Iranians | 100.0 /100 | #7 | Exceptional 22.3% |
| Cypriots | 100.0 /100 | #8 | Exceptional 21.8% |
| Thais | 100.0 /100 | #9 | Exceptional 21.7% |
| Immigrants | Iran | 100.0 /100 | #10 | Exceptional 21.6% |
| Immigrants | China | 100.0 /100 | #11 | Exceptional 21.2% |
| Eastern Europeans | 100.0 /100 | #12 | Exceptional 21.1% |
| Immigrants | Australia | 100.0 /100 | #13 | Exceptional 20.9% |
| Immigrants | Switzerland | 100.0 /100 | #14 | Exceptional 20.9% |
| Immigrants | Eastern Asia | 100.0 /100 | #15 | Exceptional 20.8% |