Northern European vs Immigrants from Zaire Professional Degree
COMPARE
Northern European
Immigrants from Zaire
Professional Degree
Professional Degree Comparison
Northern Europeans
Immigrants from Zaire
5.2%
PROFESSIONAL DEGREE
99.3/ 100
METRIC RATING
93rd/ 347
METRIC RANK
4.5%
PROFESSIONAL DEGREE
57.4/ 100
METRIC RATING
170th/ 347
METRIC RANK
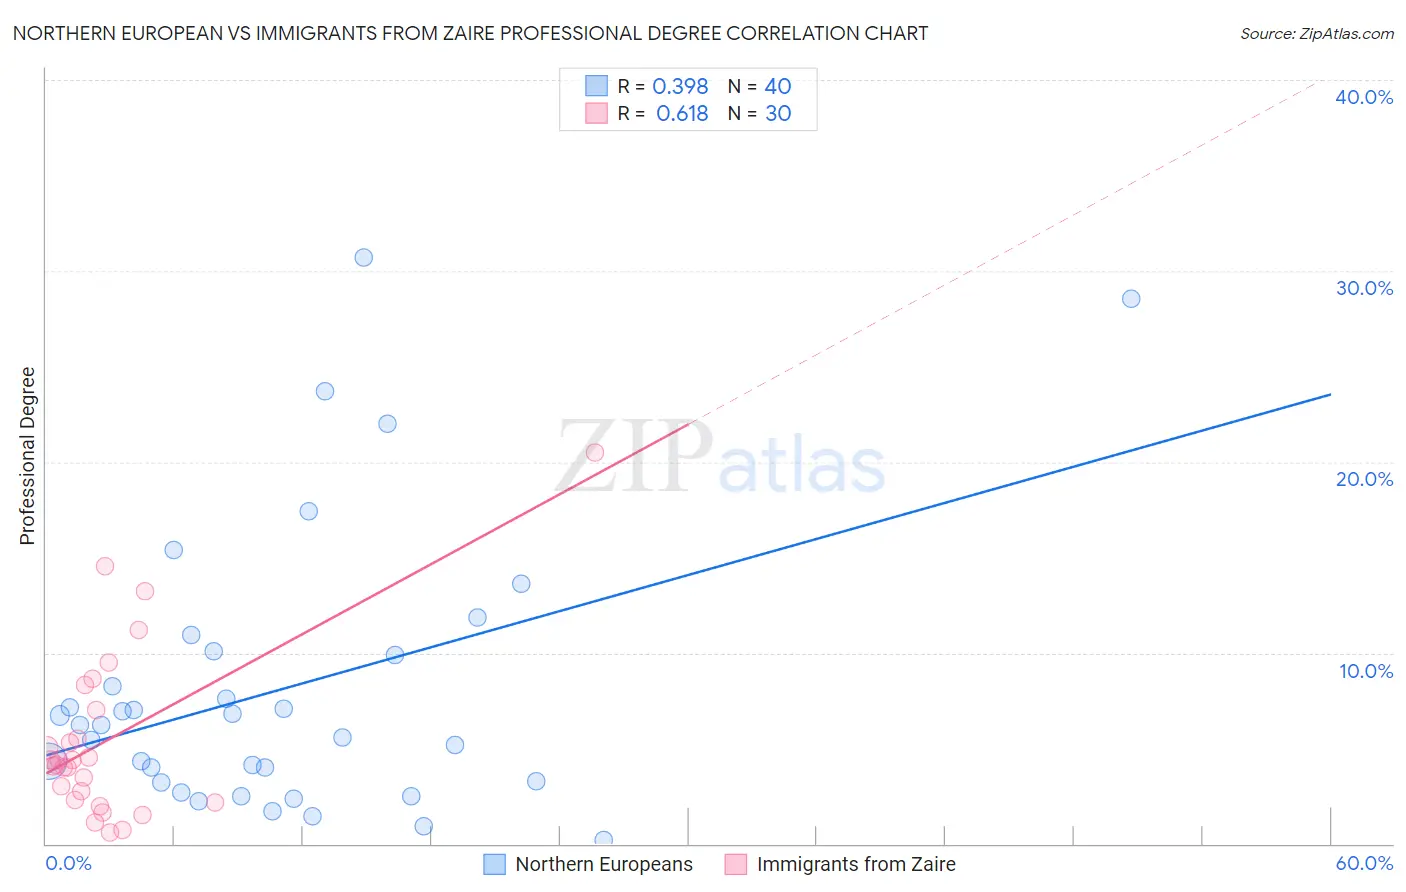
Northern European vs Immigrants from Zaire Professional Degree Correlation Chart
The statistical analysis conducted on geographies consisting of 405,045,540 people shows a mild positive correlation between the proportion of Northern Europeans and percentage of population with at least professional degree education in the United States with a correlation coefficient (R) of 0.398 and weighted average of 5.2%. Similarly, the statistical analysis conducted on geographies consisting of 107,228,641 people shows a significant positive correlation between the proportion of Immigrants from Zaire and percentage of population with at least professional degree education in the United States with a correlation coefficient (R) of 0.618 and weighted average of 4.5%, a difference of 16.9%.
Professional Degree Correlation Summary
| Measurement | Northern European | Immigrants from Zaire |
| Minimum | 0.22% | 0.59% |
| Maximum | 30.7% | 20.5% |
| Range | 30.5% | 19.9% |
| Mean | 8.1% | 5.5% |
| Median | 6.2% | 4.2% |
| Interquartile 25% (IQ1) | 3.2% | 2.3% |
| Interquartile 75% (IQ3) | 10.0% | 7.0% |
| Interquartile Range (IQR) | 6.7% | 4.7% |
| Standard Deviation (Sample) | 7.3% | 4.5% |
| Standard Deviation (Population) | 7.2% | 4.5% |
Similar Demographics by Professional Degree
Demographics Similar to Northern Europeans by Professional Degree
In terms of professional degree, the demographic groups most similar to Northern Europeans are Alsatian (5.2%, a difference of 0.020%), Zimbabwean (5.2%, a difference of 0.20%), Immigrants from Uzbekistan (5.2%, a difference of 0.61%), Immigrants from Eastern Europe (5.2%, a difference of 0.65%), and Laotian (5.2%, a difference of 0.68%).
| Demographics | Rating | Rank | Professional Degree |
| Greeks | 99.6 /100 | #86 | Exceptional 5.3% |
| Immigrants | Chile | 99.5 /100 | #87 | Exceptional 5.3% |
| Egyptians | 99.5 /100 | #88 | Exceptional 5.3% |
| Chileans | 99.5 /100 | #89 | Exceptional 5.3% |
| Immigrants | Scotland | 99.5 /100 | #90 | Exceptional 5.3% |
| Laotians | 99.5 /100 | #91 | Exceptional 5.2% |
| Immigrants | Eastern Europe | 99.5 /100 | #92 | Exceptional 5.2% |
| Northern Europeans | 99.3 /100 | #93 | Exceptional 5.2% |
| Alsatians | 99.3 /100 | #94 | Exceptional 5.2% |
| Zimbabweans | 99.3 /100 | #95 | Exceptional 5.2% |
| Immigrants | Uzbekistan | 99.2 /100 | #96 | Exceptional 5.2% |
| Syrians | 99.1 /100 | #97 | Exceptional 5.2% |
| Austrians | 99.1 /100 | #98 | Exceptional 5.2% |
| Immigrants | Italy | 99.1 /100 | #99 | Exceptional 5.2% |
| Ugandans | 98.8 /100 | #100 | Exceptional 5.1% |
Demographics Similar to Immigrants from Zaire by Professional Degree
In terms of professional degree, the demographic groups most similar to Immigrants from Zaire are Chinese (4.5%, a difference of 0.18%), Immigrants from Sierra Leone (4.5%, a difference of 0.19%), Immigrants from Bangladesh (4.4%, a difference of 0.22%), Immigrants from Afghanistan (4.5%, a difference of 0.26%), and Immigrants from Colombia (4.5%, a difference of 0.29%).
| Demographics | Rating | Rank | Professional Degree |
| Sierra Leoneans | 64.3 /100 | #163 | Good 4.5% |
| Swiss | 61.0 /100 | #164 | Good 4.5% |
| Costa Ricans | 59.9 /100 | #165 | Average 4.5% |
| Immigrants | Colombia | 59.4 /100 | #166 | Average 4.5% |
| Immigrants | Afghanistan | 59.2 /100 | #167 | Average 4.5% |
| Immigrants | Sierra Leone | 58.7 /100 | #168 | Average 4.5% |
| Chinese | 58.6 /100 | #169 | Average 4.5% |
| Immigrants | Zaire | 57.4 /100 | #170 | Average 4.5% |
| Immigrants | Bangladesh | 56.0 /100 | #171 | Average 4.4% |
| Spaniards | 52.0 /100 | #172 | Average 4.4% |
| English | 50.1 /100 | #173 | Average 4.4% |
| Kenyans | 50.0 /100 | #174 | Average 4.4% |
| Irish | 50.0 /100 | #175 | Average 4.4% |
| Immigrants | Peru | 49.3 /100 | #176 | Average 4.4% |
| Celtics | 47.6 /100 | #177 | Average 4.4% |