Northern European vs Immigrants from Pakistan Doctorate Degree
COMPARE
Northern European
Immigrants from Pakistan
Doctorate Degree
Doctorate Degree Comparison
Northern Europeans
Immigrants from Pakistan
2.2%
DOCTORATE DEGREE
99.7/ 100
METRIC RATING
79th/ 347
METRIC RANK
2.1%
DOCTORATE DEGREE
97.1/ 100
METRIC RATING
111th/ 347
METRIC RANK
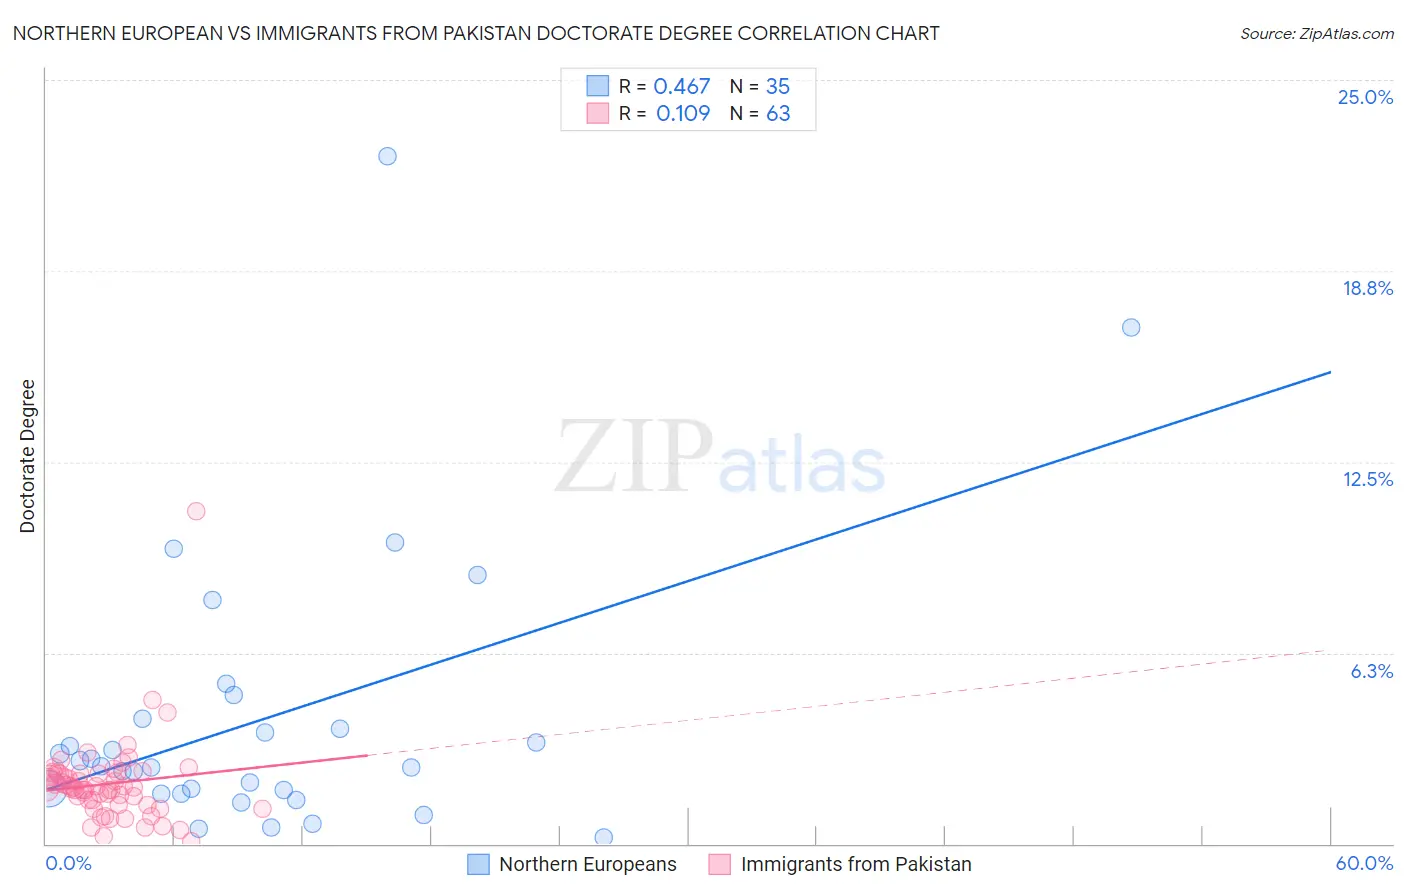
Northern European vs Immigrants from Pakistan Doctorate Degree Correlation Chart
The statistical analysis conducted on geographies consisting of 401,433,855 people shows a moderate positive correlation between the proportion of Northern Europeans and percentage of population with at least doctorate degree education in the United States with a correlation coefficient (R) of 0.467 and weighted average of 2.2%. Similarly, the statistical analysis conducted on geographies consisting of 283,055,701 people shows a poor positive correlation between the proportion of Immigrants from Pakistan and percentage of population with at least doctorate degree education in the United States with a correlation coefficient (R) of 0.109 and weighted average of 2.1%, a difference of 7.5%.
Doctorate Degree Correlation Summary
| Measurement | Northern European | Immigrants from Pakistan |
| Minimum | 0.22% | 0.090% |
| Maximum | 22.5% | 10.9% |
| Range | 22.3% | 10.8% |
| Mean | 4.1% | 2.0% |
| Median | 2.5% | 1.8% |
| Interquartile 25% (IQ1) | 1.6% | 1.3% |
| Interquartile 75% (IQ3) | 4.1% | 2.3% |
| Interquartile Range (IQR) | 2.5% | 1.0% |
| Standard Deviation (Sample) | 4.7% | 1.4% |
| Standard Deviation (Population) | 4.6% | 1.4% |
Similar Demographics by Doctorate Degree
Demographics Similar to Northern Europeans by Doctorate Degree
In terms of doctorate degree, the demographic groups most similar to Northern Europeans are Immigrants from Belarus (2.2%, a difference of 0.070%), Ugandan (2.2%, a difference of 0.28%), Immigrants from Argentina (2.2%, a difference of 0.34%), Immigrants from Lebanon (2.2%, a difference of 0.59%), and Immigrants from Hungary (2.2%, a difference of 0.60%).
| Demographics | Rating | Rank | Doctorate Degree |
| Immigrants | Canada | 99.8 /100 | #72 | Exceptional 2.3% |
| Immigrants | Bulgaria | 99.8 /100 | #73 | Exceptional 2.3% |
| Immigrants | North America | 99.8 /100 | #74 | Exceptional 2.2% |
| Immigrants | Western Asia | 99.8 /100 | #75 | Exceptional 2.2% |
| Immigrants | Hungary | 99.8 /100 | #76 | Exceptional 2.2% |
| Immigrants | Lebanon | 99.8 /100 | #77 | Exceptional 2.2% |
| Immigrants | Belarus | 99.7 /100 | #78 | Exceptional 2.2% |
| Northern Europeans | 99.7 /100 | #79 | Exceptional 2.2% |
| Ugandans | 99.7 /100 | #80 | Exceptional 2.2% |
| Immigrants | Argentina | 99.7 /100 | #81 | Exceptional 2.2% |
| Immigrants | Uganda | 99.6 /100 | #82 | Exceptional 2.2% |
| Immigrants | Lithuania | 99.6 /100 | #83 | Exceptional 2.2% |
| Immigrants | England | 99.6 /100 | #84 | Exceptional 2.2% |
| Immigrants | Brazil | 99.6 /100 | #85 | Exceptional 2.2% |
| Egyptians | 99.4 /100 | #86 | Exceptional 2.2% |
Demographics Similar to Immigrants from Pakistan by Doctorate Degree
In terms of doctorate degree, the demographic groups most similar to Immigrants from Pakistan are Syrian (2.1%, a difference of 0.020%), Brazilian (2.1%, a difference of 0.060%), Ukrainian (2.1%, a difference of 0.13%), Immigrants from Germany (2.1%, a difference of 0.19%), and Immigrants from Italy (2.1%, a difference of 0.23%).
| Demographics | Rating | Rank | Doctorate Degree |
| Austrians | 98.0 /100 | #104 | Exceptional 2.1% |
| Arabs | 97.8 /100 | #105 | Exceptional 2.1% |
| Sudanese | 97.7 /100 | #106 | Exceptional 2.1% |
| Europeans | 97.5 /100 | #107 | Exceptional 2.1% |
| Immigrants | Germany | 97.3 /100 | #108 | Exceptional 2.1% |
| Ukrainians | 97.2 /100 | #109 | Exceptional 2.1% |
| Brazilians | 97.2 /100 | #110 | Exceptional 2.1% |
| Immigrants | Pakistan | 97.1 /100 | #111 | Exceptional 2.1% |
| Syrians | 97.1 /100 | #112 | Exceptional 2.1% |
| Immigrants | Italy | 96.9 /100 | #113 | Exceptional 2.1% |
| Immigrants | Croatia | 96.8 /100 | #114 | Exceptional 2.1% |
| Taiwanese | 96.7 /100 | #115 | Exceptional 2.1% |
| Maltese | 96.2 /100 | #116 | Exceptional 2.1% |
| Lebanese | 96.0 /100 | #117 | Exceptional 2.1% |
| Icelanders | 96.0 /100 | #118 | Exceptional 2.1% |