Northern European vs Immigrants from Asia Associate's Degree
COMPARE
Northern European
Immigrants from Asia
Associate's Degree
Associate's Degree Comparison
Northern Europeans
Immigrants from Asia
49.5%
ASSOCIATE'S DEGREE
97.3/ 100
METRIC RATING
101st/ 347
METRIC RANK
52.0%
ASSOCIATE'S DEGREE
99.8/ 100
METRIC RATING
53rd/ 347
METRIC RANK
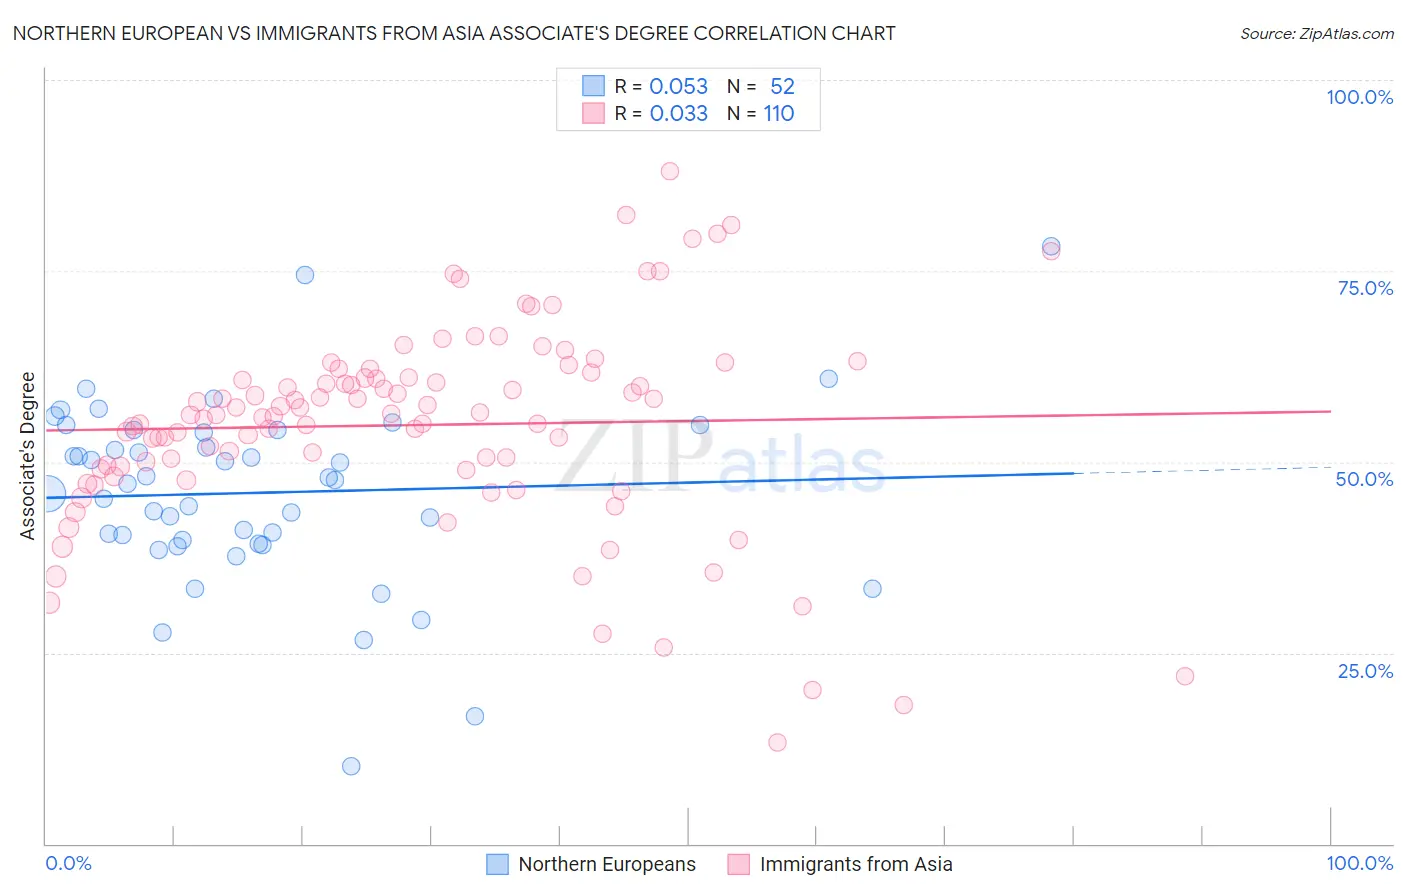
Northern European vs Immigrants from Asia Associate's Degree Correlation Chart
The statistical analysis conducted on geographies consisting of 406,085,887 people shows a slight positive correlation between the proportion of Northern Europeans and percentage of population with at least associate's degree education in the United States with a correlation coefficient (R) of 0.053 and weighted average of 49.5%. Similarly, the statistical analysis conducted on geographies consisting of 549,095,102 people shows no correlation between the proportion of Immigrants from Asia and percentage of population with at least associate's degree education in the United States with a correlation coefficient (R) of 0.033 and weighted average of 52.0%, a difference of 5.0%.
Associate's Degree Correlation Summary
| Measurement | Northern European | Immigrants from Asia |
| Minimum | 10.2% | 13.2% |
| Maximum | 78.2% | 88.0% |
| Range | 68.0% | 74.8% |
| Mean | 46.0% | 54.8% |
| Median | 47.4% | 56.2% |
| Interquartile 25% (IQ1) | 39.6% | 49.0% |
| Interquartile 75% (IQ3) | 54.0% | 61.1% |
| Interquartile Range (IQR) | 14.4% | 12.0% |
| Standard Deviation (Sample) | 12.1% | 13.4% |
| Standard Deviation (Population) | 12.0% | 13.4% |
Similar Demographics by Associate's Degree
Demographics Similar to Northern Europeans by Associate's Degree
In terms of associate's degree, the demographic groups most similar to Northern Europeans are Chilean (49.4%, a difference of 0.030%), Ukrainian (49.4%, a difference of 0.13%), Immigrants from Nepal (49.5%, a difference of 0.16%), Venezuelan (49.4%, a difference of 0.20%), and Croatian (49.3%, a difference of 0.34%).
| Demographics | Rating | Rank | Associate's Degree |
| Laotians | 98.4 /100 | #94 | Exceptional 49.9% |
| Immigrants | England | 98.0 /100 | #95 | Exceptional 49.7% |
| Romanians | 98.0 /100 | #96 | Exceptional 49.7% |
| Immigrants | Ukraine | 98.0 /100 | #97 | Exceptional 49.7% |
| Immigrants | Northern Africa | 97.9 /100 | #98 | Exceptional 49.7% |
| Macedonians | 97.8 /100 | #99 | Exceptional 49.6% |
| Immigrants | Nepal | 97.5 /100 | #100 | Exceptional 49.5% |
| Northern Europeans | 97.3 /100 | #101 | Exceptional 49.5% |
| Chileans | 97.3 /100 | #102 | Exceptional 49.4% |
| Ukrainians | 97.1 /100 | #103 | Exceptional 49.4% |
| Venezuelans | 97.0 /100 | #104 | Exceptional 49.4% |
| Croatians | 96.8 /100 | #105 | Exceptional 49.3% |
| Immigrants | Italy | 96.7 /100 | #106 | Exceptional 49.3% |
| Syrians | 96.7 /100 | #107 | Exceptional 49.3% |
| Jordanians | 96.6 /100 | #108 | Exceptional 49.2% |
Demographics Similar to Immigrants from Asia by Associate's Degree
In terms of associate's degree, the demographic groups most similar to Immigrants from Asia are Bolivian (52.0%, a difference of 0.020%), Immigrants from Spain (51.9%, a difference of 0.10%), Australian (51.9%, a difference of 0.13%), Immigrants from Czechoslovakia (51.9%, a difference of 0.15%), and Immigrants from Greece (52.1%, a difference of 0.23%).
| Demographics | Rating | Rank | Associate's Degree |
| Immigrants | Bulgaria | 99.9 /100 | #46 | Exceptional 52.4% |
| Immigrants | Kuwait | 99.9 /100 | #47 | Exceptional 52.4% |
| Immigrants | Norway | 99.9 /100 | #48 | Exceptional 52.2% |
| Immigrants | Austria | 99.9 /100 | #49 | Exceptional 52.1% |
| Asians | 99.9 /100 | #50 | Exceptional 52.1% |
| Immigrants | Greece | 99.9 /100 | #51 | Exceptional 52.1% |
| Bolivians | 99.8 /100 | #52 | Exceptional 52.0% |
| Immigrants | Asia | 99.8 /100 | #53 | Exceptional 52.0% |
| Immigrants | Spain | 99.8 /100 | #54 | Exceptional 51.9% |
| Australians | 99.8 /100 | #55 | Exceptional 51.9% |
| Immigrants | Czechoslovakia | 99.8 /100 | #56 | Exceptional 51.9% |
| Paraguayans | 99.8 /100 | #57 | Exceptional 51.8% |
| New Zealanders | 99.8 /100 | #58 | Exceptional 51.8% |
| Immigrants | Serbia | 99.8 /100 | #59 | Exceptional 51.7% |
| Immigrants | Bolivia | 99.7 /100 | #60 | Exceptional 51.5% |