Northern European vs Immigrants from Africa College, Under 1 year
COMPARE
Northern European
Immigrants from Africa
College, Under 1 year
College, Under 1 year Comparison
Northern Europeans
Immigrants from Africa
69.0%
COLLEGE, UNDER 1 YEAR
99.4/ 100
METRIC RATING
64th/ 347
METRIC RANK
65.3%
COLLEGE, UNDER 1 YEAR
44.7/ 100
METRIC RATING
182nd/ 347
METRIC RANK
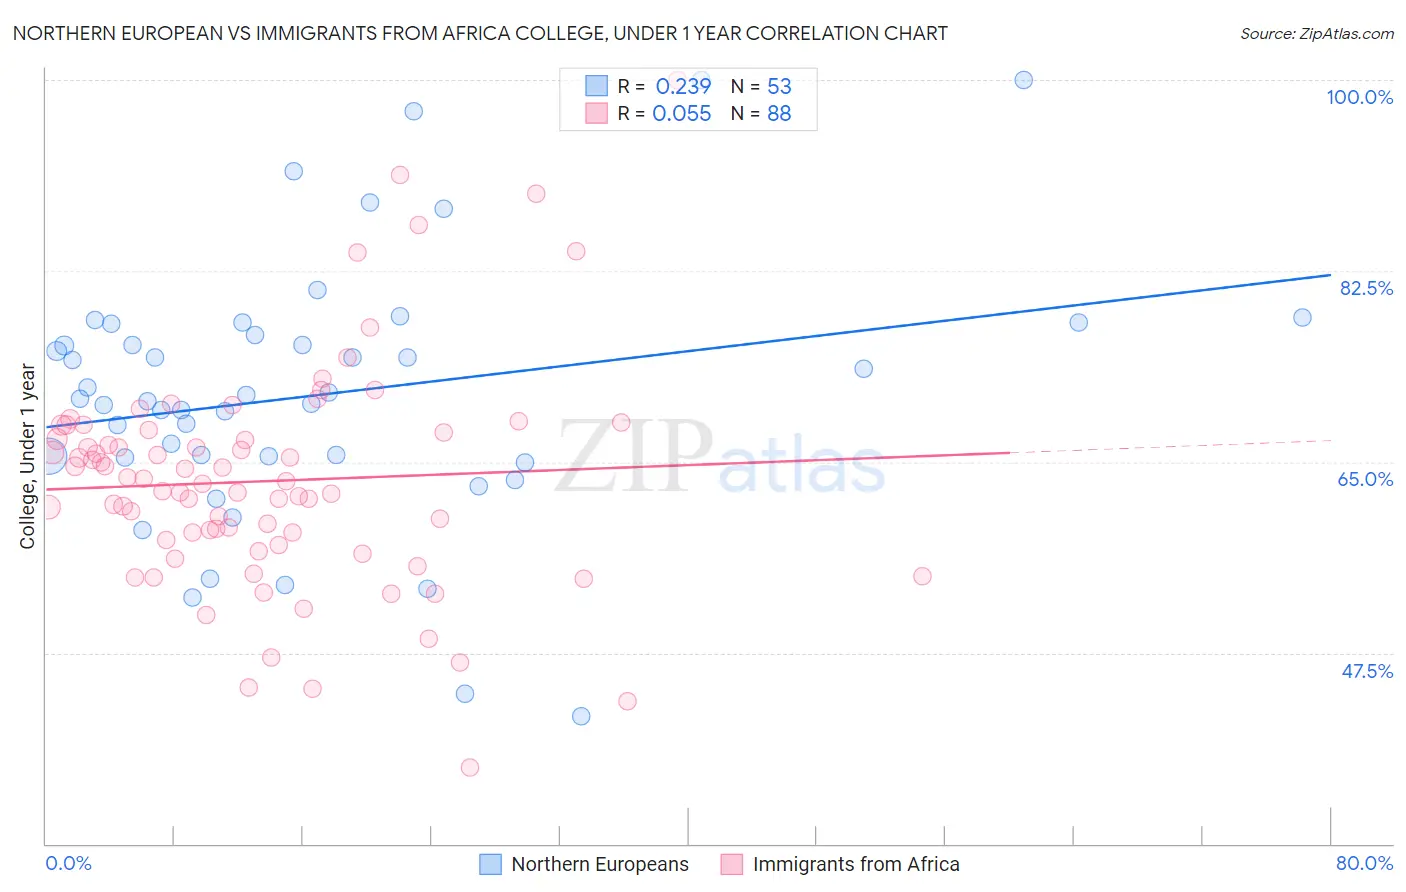
Northern European vs Immigrants from Africa College, Under 1 year Correlation Chart
The statistical analysis conducted on geographies consisting of 406,096,233 people shows a weak positive correlation between the proportion of Northern Europeans and percentage of population with at least college, under 1 year education in the United States with a correlation coefficient (R) of 0.239 and weighted average of 69.0%. Similarly, the statistical analysis conducted on geographies consisting of 469,444,786 people shows a slight positive correlation between the proportion of Immigrants from Africa and percentage of population with at least college, under 1 year education in the United States with a correlation coefficient (R) of 0.055 and weighted average of 65.3%, a difference of 5.8%.
College, Under 1 year Correlation Summary
| Measurement | Northern European | Immigrants from Africa |
| Minimum | 41.7% | 37.0% |
| Maximum | 100.0% | 100.0% |
| Range | 58.3% | 63.0% |
| Mean | 71.2% | 63.2% |
| Median | 70.7% | 63.1% |
| Interquartile 25% (IQ1) | 65.5% | 57.7% |
| Interquartile 75% (IQ3) | 77.2% | 67.9% |
| Interquartile Range (IQR) | 11.7% | 10.2% |
| Standard Deviation (Sample) | 12.0% | 10.4% |
| Standard Deviation (Population) | 11.9% | 10.3% |
Similar Demographics by College, Under 1 year
Demographics Similar to Northern Europeans by College, Under 1 year
In terms of college, under 1 year, the demographic groups most similar to Northern Europeans are Immigrants from Moldova (69.0%, a difference of 0.020%), Immigrants from Canada (69.1%, a difference of 0.040%), Immigrants from North America (69.0%, a difference of 0.040%), Immigrants from Kazakhstan (69.2%, a difference of 0.17%), and Immigrants from Belarus (69.2%, a difference of 0.17%).
| Demographics | Rating | Rank | College, Under 1 year |
| Asians | 99.6 /100 | #57 | Exceptional 69.4% |
| Immigrants | Malaysia | 99.6 /100 | #58 | Exceptional 69.3% |
| Immigrants | Serbia | 99.5 /100 | #59 | Exceptional 69.3% |
| Immigrants | Asia | 99.5 /100 | #60 | Exceptional 69.2% |
| Immigrants | Kazakhstan | 99.5 /100 | #61 | Exceptional 69.2% |
| Immigrants | Belarus | 99.5 /100 | #62 | Exceptional 69.2% |
| Immigrants | Canada | 99.4 /100 | #63 | Exceptional 69.1% |
| Northern Europeans | 99.4 /100 | #64 | Exceptional 69.0% |
| Immigrants | Moldova | 99.3 /100 | #65 | Exceptional 69.0% |
| Immigrants | North America | 99.3 /100 | #66 | Exceptional 69.0% |
| Immigrants | Zimbabwe | 99.2 /100 | #67 | Exceptional 68.9% |
| Immigrants | Indonesia | 99.2 /100 | #68 | Exceptional 68.9% |
| Immigrants | Romania | 99.2 /100 | #69 | Exceptional 68.9% |
| Lithuanians | 99.1 /100 | #70 | Exceptional 68.8% |
| Immigrants | Europe | 99.1 /100 | #71 | Exceptional 68.8% |
Demographics Similar to Immigrants from Africa by College, Under 1 year
In terms of college, under 1 year, the demographic groups most similar to Immigrants from Africa are Spaniard (65.3%, a difference of 0.040%), Dutch (65.3%, a difference of 0.060%), Immigrants from Poland (65.2%, a difference of 0.10%), Bermudan (65.2%, a difference of 0.12%), and Sri Lankan (65.2%, a difference of 0.13%).
| Demographics | Rating | Rank | College, Under 1 year |
| Scotch-Irish | 49.5 /100 | #175 | Average 65.4% |
| French | 48.9 /100 | #176 | Average 65.4% |
| Immigrants | North Macedonia | 48.6 /100 | #177 | Average 65.4% |
| German Russians | 48.3 /100 | #178 | Average 65.4% |
| Guamanians/Chamorros | 48.2 /100 | #179 | Average 65.4% |
| Dutch | 46.1 /100 | #180 | Average 65.3% |
| Spaniards | 45.5 /100 | #181 | Average 65.3% |
| Immigrants | Africa | 44.7 /100 | #182 | Average 65.3% |
| Immigrants | Poland | 42.6 /100 | #183 | Average 65.2% |
| Bermudans | 42.0 /100 | #184 | Average 65.2% |
| Sri Lankans | 41.7 /100 | #185 | Average 65.2% |
| Immigrants | Sierra Leone | 39.7 /100 | #186 | Fair 65.1% |
| Immigrants | Southern Europe | 34.3 /100 | #187 | Fair 64.9% |
| Immigrants | Albania | 32.0 /100 | #188 | Fair 64.9% |
| Spanish | 31.6 /100 | #189 | Fair 64.9% |