Nonimmigrants vs Trinidadian and Tobagonian 7th Grade

COMPARE

Nonimmigrants
Race
Ancestry
AfghanAfricanAlaska NativeAlaskan AthabascanAlbanianAleutAlsatianAmericanApacheArabArapahoArgentineanArmenianAssyrian/Chaldean/SyriacAustralianAustrianBahamianBangladeshiBarbadianBasqueBelgianBelizeanBermudanBhutaneseBlackfeetBolivianBrazilianBritishBritish West IndianBulgarianBurmeseCajunCambodianCanadianCape VerdeanCarpatho RusynCelticCentral AmericanCentral American IndianCherokeeCheyenneChickasawChileanChineseChippewaChoctawColombianColvilleComancheCosta RicanCreeCreekCroatianCrowCubanCypriotCzechCzechoslovakianDanishDelawareDominicanDutchDutch West IndianEastern EuropeanEcuadorianEgyptianEnglishEstonianEthiopianEuropeanFijianFilipinoFinnishFrenchFrench American IndianFrench CanadianGermanGerman RussianGhanaianGreekGuamanian/ChamorroGuatemalanGuyaneseHaitianHmongHonduranHopiHoumaHungarianIcelanderIndian (Asian)IndonesianInupiatIranianIraqiIrishIroquoisIsraeliItalianJamaicanJapaneseJordanianKenyanKiowaKoreanLaotianLatvianLebaneseLiberianLithuanianLumbeeLuxembourgerMacedonianMalaysianMalteseMarshalleseMenomineeMexicanMexican American IndianMongolianMoroccanNative HawaiianNavajoNepaleseNew ZealanderNicaraguanNigerianNorthern EuropeanNorwegianOkinawanOsageOttawaPaiutePakistaniPalestinianPanamanianParaguayanPennsylvania GermanPeruvianPimaPolishPortuguesePotawatomiPuebloPuerto RicanPuget Sound SalishRomanianRussianSalvadoranSamoanScandinavianScotch-IrishScottishSeminoleSenegaleseSerbianShoshoneSierra LeoneanSiouxSlavicSlovakSloveneSomaliSouth AfricanSouth AmericanSouth American IndianSoviet UnionSpaniardSpanishSpanish AmericanSpanish American IndianSri LankanSubsaharan AfricanSudaneseSwedishSwissSyrianTaiwaneseThaiTlingit-HaidaTohono O'OdhamTonganTsimshianTurkishU.S. Virgin IslanderUgandanUkrainianUruguayanUteVenezuelanVietnameseWelshWest IndianYakamaYaquiYugoslavianYumanYup'ikZimbabwean
Immigration
NonimmigrantsImmigrantsAfghanistanAfricaAlbaniaArgentinaArmeniaAsiaAustraliaAustriaBahamasBangladeshBarbadosBelarusBelgiumBelizeBoliviaBosnia and HerzegovinaBrazilBulgariaBurma/MyanmarCabo VerdeCambodiaCameroonCanadaCaribbeanCentral AmericaChileChinaColombiaCongoCosta RicaCroatiaCubaCzechoslovakiaDenmarkDominicaDominican RepublicEastern AfricaEastern AsiaEastern EuropeEcuadorEgyptEl SalvadorEnglandEritreaEthiopiaEuropeFijiFranceGermanyGhanaGreeceGrenadaGuatemalaGuyanaHaitiHondurasHong KongHungaryIndiaIndonesiaIranIraqIrelandIsraelItalyJamaicaJapanJordanKazakhstanKenyaKoreaKuwaitLaosLatin AmericaLatviaLebanonLiberiaLithuaniaMalaysiaMexicoMicronesiaMiddle AfricaMoldovaMoroccoNepalNetherlandsNicaraguaNigeriaNorth AmericaNorth MacedoniaNorthern AfricaNorthern EuropeNorwayOceaniaPakistanPanamaPeruPhilippinesPolandPortugalRomaniaRussiaSaudi ArabiaScotlandSenegalSerbiaSierra LeoneSingaporeSomaliaSouth AfricaSouth AmericaSouth Central AsiaSouth Eastern AsiaSouthern EuropeSpainSri LankaSt. Vincent and the GrenadinesSudanSwedenSwitzerlandSyriaTaiwanThailandTrinidad and TobagoTurkeyUgandaUkraineUruguayUzbekistanVenezuelaVietnamWest IndiesWestern AfricaWestern AsiaWestern EuropeYemenZaireZimbabweAzores
Trinidadian and Tobagonian
Race
Ancestry
AfghanAfricanAlaska NativeAlaskan AthabascanAlbanianAleutAlsatianAmericanApacheArabArapahoArgentineanArmenianAssyrian/Chaldean/SyriacAustralianAustrianBahamianBangladeshiBarbadianBasqueBelgianBelizeanBermudanBhutaneseBlackfeetBolivianBrazilianBritishBritish West IndianBulgarianBurmeseCajunCambodianCanadianCape VerdeanCarpatho RusynCelticCentral AmericanCentral American IndianCherokeeCheyenneChickasawChileanChineseChippewaChoctawColombianColvilleComancheCosta RicanCreeCreekCroatianCrowCubanCypriotCzechCzechoslovakianDanishDelawareDominicanDutchDutch West IndianEastern EuropeanEcuadorianEgyptianEnglishEstonianEthiopianEuropeanFijianFilipinoFinnishFrenchFrench American IndianFrench CanadianGermanGerman RussianGhanaianGreekGuamanian/ChamorroGuatemalanGuyaneseHaitianHmongHonduranHopiHoumaHungarianIcelanderIndian (Asian)IndonesianInupiatIranianIraqiIrishIroquoisIsraeliItalianJamaicanJapaneseJordanianKenyanKiowaKoreanLaotianLatvianLebaneseLiberianLithuanianLumbeeLuxembourgerMacedonianMalaysianMalteseMarshalleseMenomineeMexicanMexican American IndianMongolianMoroccanNative HawaiianNavajoNepaleseNew ZealanderNicaraguanNigerianNorthern EuropeanNorwegianOkinawanOsageOttawaPaiutePakistaniPalestinianPanamanianParaguayanPennsylvania GermanPeruvianPimaPolishPortuguesePotawatomiPuebloPuerto RicanPuget Sound SalishRomanianRussianSalvadoranSamoanScandinavianScotch-IrishScottishSeminoleSenegaleseSerbianShoshoneSierra LeoneanSiouxSlavicSlovakSloveneSomaliSouth AfricanSouth AmericanSouth American IndianSoviet UnionSpaniardSpanishSpanish AmericanSpanish American IndianSri LankanSubsaharan AfricanSudaneseSwedishSwissSyrianTaiwaneseThaiTlingit-HaidaTohono O'OdhamTonganTrinidadian and TobagonianTsimshianTurkishU.S. Virgin IslanderUgandanUkrainianUruguayanUteVenezuelanVietnameseWelshWest IndianYakamaYaquiYugoslavianYumanYup'ikZimbabwean
Immigration
ImmigrantsAfghanistanAfricaAlbaniaArgentinaArmeniaAsiaAustraliaAustriaBahamasBangladeshBarbadosBelarusBelgiumBelizeBoliviaBosnia and HerzegovinaBrazilBulgariaBurma/MyanmarCabo VerdeCambodiaCameroonCanadaCaribbeanCentral AmericaChileChinaColombiaCongoCosta RicaCroatiaCubaCzechoslovakiaDenmarkDominicaDominican RepublicEastern AfricaEastern AsiaEastern EuropeEcuadorEgyptEl SalvadorEnglandEritreaEthiopiaEuropeFijiFranceGermanyGhanaGreeceGrenadaGuatemalaGuyanaHaitiHondurasHong KongHungaryIndiaIndonesiaIranIraqIrelandIsraelItalyJamaicaJapanJordanKazakhstanKenyaKoreaKuwaitLaosLatin AmericaLatviaLebanonLiberiaLithuaniaMalaysiaMexicoMicronesiaMiddle AfricaMoldovaMoroccoNepalNetherlandsNicaraguaNigeriaNorth AmericaNorth MacedoniaNorthern AfricaNorthern EuropeNorwayOceaniaPakistanPanamaPeruPhilippinesPolandPortugalRomaniaRussiaSaudi ArabiaScotlandSenegalSerbiaSierra LeoneSingaporeSomaliaSouth AfricaSouth AmericaSouth Central AsiaSouth Eastern AsiaSouthern EuropeSpainSri LankaSt. Vincent and the GrenadinesSudanSwedenSwitzerlandSyriaTaiwanThailandTrinidad and TobagoTurkeyUgandaUkraineUruguayUzbekistanVenezuelaVietnamWest IndiesWestern AfricaWestern AsiaWestern EuropeYemenZaireZimbabweAzores
7th Grade
Income
Poverty
Unemployment
Labor Participation
Family Structure
Vehicle Availability
Education Level
Disability

7th Grade Comparison

Nonimmigrants

Trinidadians and Tobagonians

Exceptional
Tragic
96.5%
7TH GRADE
97.0/ 100
METRIC RATING
112th/ 347
METRIC RANK
95.2%
7TH GRADE
0.3/ 100
METRIC RATING
269th/ 347
METRIC RANK

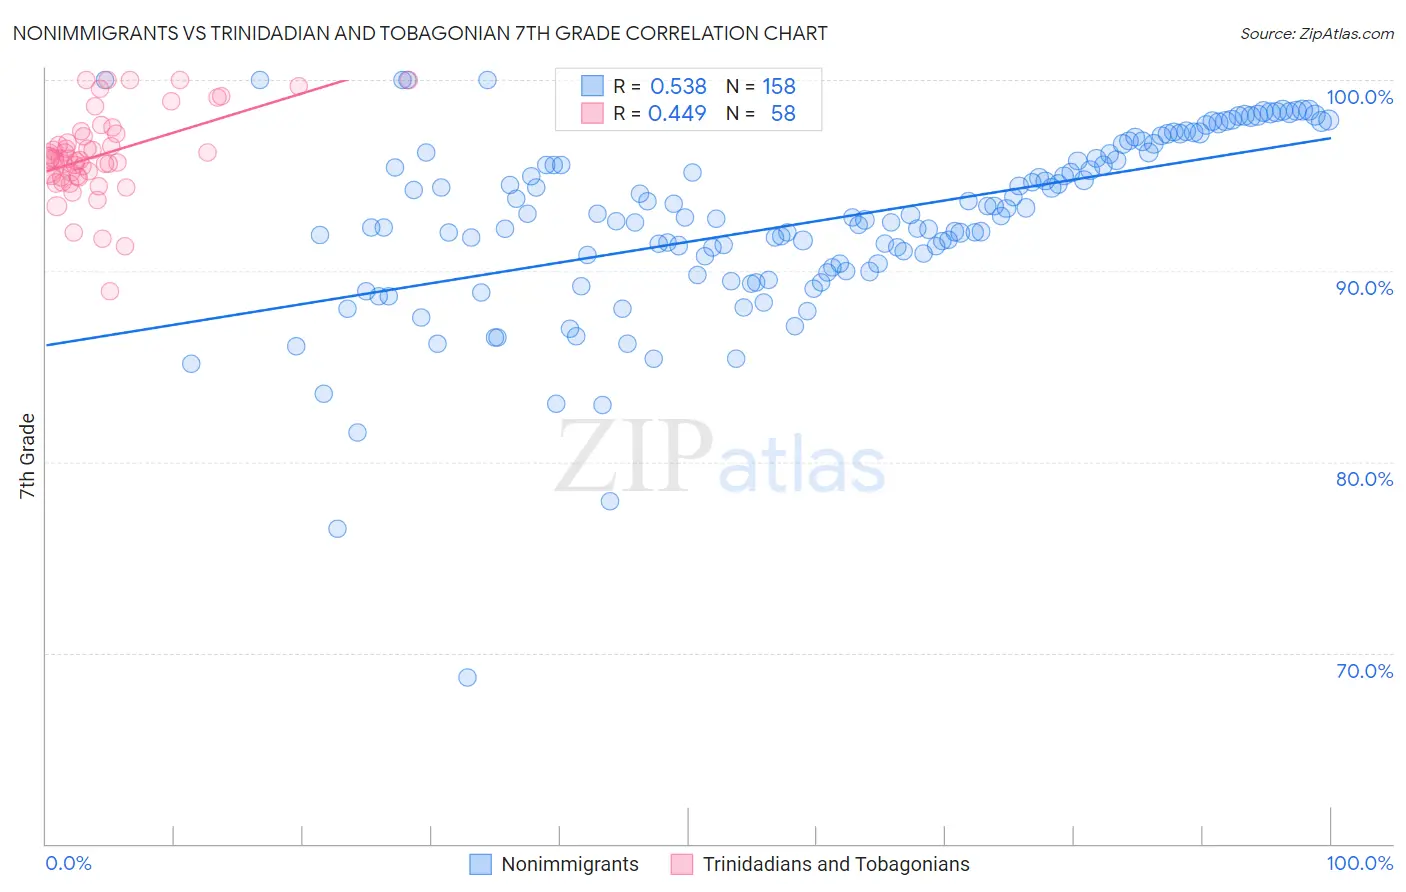
Nonimmigrants vs Trinidadian and Tobagonian 7th Grade Correlation Chart

The statistical analysis conducted on geographies consisting of 585,374,406 people shows a substantial positive correlation between the proportion of Nonimmigrants and percentage of population with at least 7th grade education in the United States with a correlation coefficient (R) of 0.538 and weighted average of 96.5%. Similarly, the statistical analysis conducted on geographies consisting of 219,881,170 people shows a moderate positive correlation between the proportion of Trinidadians and Tobagonians and percentage of population with at least 7th grade education in the United States with a correlation coefficient (R) of 0.449 and weighted average of 95.2%, a difference of 1.5%.
Nonimmigrants vs Trinidadian and Tobagonian 7th Grade

7th Grade Correlation Summary

MeasurementNonimmigrantsTrinidadian and Tobagonian
Minimum68.7%89.0%
Maximum100.0%100.0%
Range31.3%11.0%
Mean92.6%96.1%
Median92.8%95.9%
Interquartile 25% (IQ1)90.2%95.0%
Interquartile 75% (IQ3)96.1%97.2%
Interquartile Range (IQR)5.9%2.2%
Standard Deviation (Sample)4.7%2.3%
Standard Deviation (Population)4.7%2.2%

Similar Demographics by 7th Grade

Demographics Similar to Nonimmigrants by 7th Grade

In terms of 7th grade, the demographic groups most similar to Nonimmigrants are Pueblo (96.5%, a difference of 0.010%), Okinawan (96.6%, a difference of 0.020%), Immigrants from Latvia (96.6%, a difference of 0.020%), Immigrants from Zimbabwe (96.5%, a difference of 0.020%), and Choctaw (96.5%, a difference of 0.020%).
DemographicsRating | Rank7th Grade
South Africans
98.0
/100
|
#105
Exceptional
96.6%
Iroquois
97.9
/100
|
#106
Exceptional
96.6%
Lumbee
97.8
/100
|
#107
Exceptional
96.6%
Immigrants | Saudi Arabia
97.8
/100
|
#108
Exceptional
96.6%
Bhutanese
97.7
/100
|
#109
Exceptional
96.6%
Okinawans
97.4
/100
|
#110
Exceptional
96.6%
Immigrants | Latvia
97.4
/100
|
#111
Exceptional
96.6%
Immigrants | Nonimmigrants
97.0
/100
|
#112
Exceptional
96.5%
Pueblo
96.8
/100
|
#113
Exceptional
96.5%
Immigrants | Zimbabwe
96.6
/100
|
#114
Exceptional
96.5%
Choctaw
96.6
/100
|
#115
Exceptional
96.5%
Syrians
96.6
/100
|
#116
Exceptional
96.5%
Immigrants | Moldova
95.7
/100
|
#117
Exceptional
96.5%
Immigrants | Japan
95.5
/100
|
#118
Exceptional
96.5%
Immigrants | Norway
95.2
/100
|
#119
Exceptional
96.5%

Demographics Similar to Trinidadians and Tobagonians by 7th Grade

In terms of 7th grade, the demographic groups most similar to Trinidadians and Tobagonians are Immigrants from Hong Kong (95.2%, a difference of 0.020%), Houma (95.1%, a difference of 0.020%), Immigrants from South America (95.1%, a difference of 0.020%), Peruvian (95.1%, a difference of 0.020%), and Immigrants from Uzbekistan (95.1%, a difference of 0.020%).
DemographicsRating | Rank7th Grade
Immigrants | Somalia
0.5
/100
|
#262
Tragic
95.2%
West Indians
0.5
/100
|
#263
Tragic
95.2%
Immigrants | Nigeria
0.4
/100
|
#264
Tragic
95.2%
Immigrants | Uruguay
0.3
/100
|
#265
Tragic
95.2%
Immigrants | Ghana
0.3
/100
|
#266
Tragic
95.2%
Yuman
0.3
/100
|
#267
Tragic
95.2%
Immigrants | Hong Kong
0.3
/100
|
#268
Tragic
95.2%
Trinidadians and Tobagonians
0.3
/100
|
#269
Tragic
95.2%
Houma
0.2
/100
|
#270
Tragic
95.1%
Immigrants | South America
0.2
/100
|
#271
Tragic
95.1%
Peruvians
0.2
/100
|
#272
Tragic
95.1%
Immigrants | Uzbekistan
0.2
/100
|
#273
Tragic
95.1%
Immigrants | Western Africa
0.2
/100
|
#274
Tragic
95.1%
Immigrants | Colombia
0.2
/100
|
#275
Tragic
95.1%
Immigrants | Thailand
0.2
/100
|
#276
Tragic
95.1%