Nonimmigrants vs Inupiat 11th Grade
COMPARE
Nonimmigrants
Inupiat
11th Grade
11th Grade Comparison
Nonimmigrants
Inupiat
92.7%
11TH GRADE
66.6/ 100
METRIC RATING
163rd/ 347
METRIC RANK
92.4%
11TH GRADE
40.7/ 100
METRIC RATING
180th/ 347
METRIC RANK
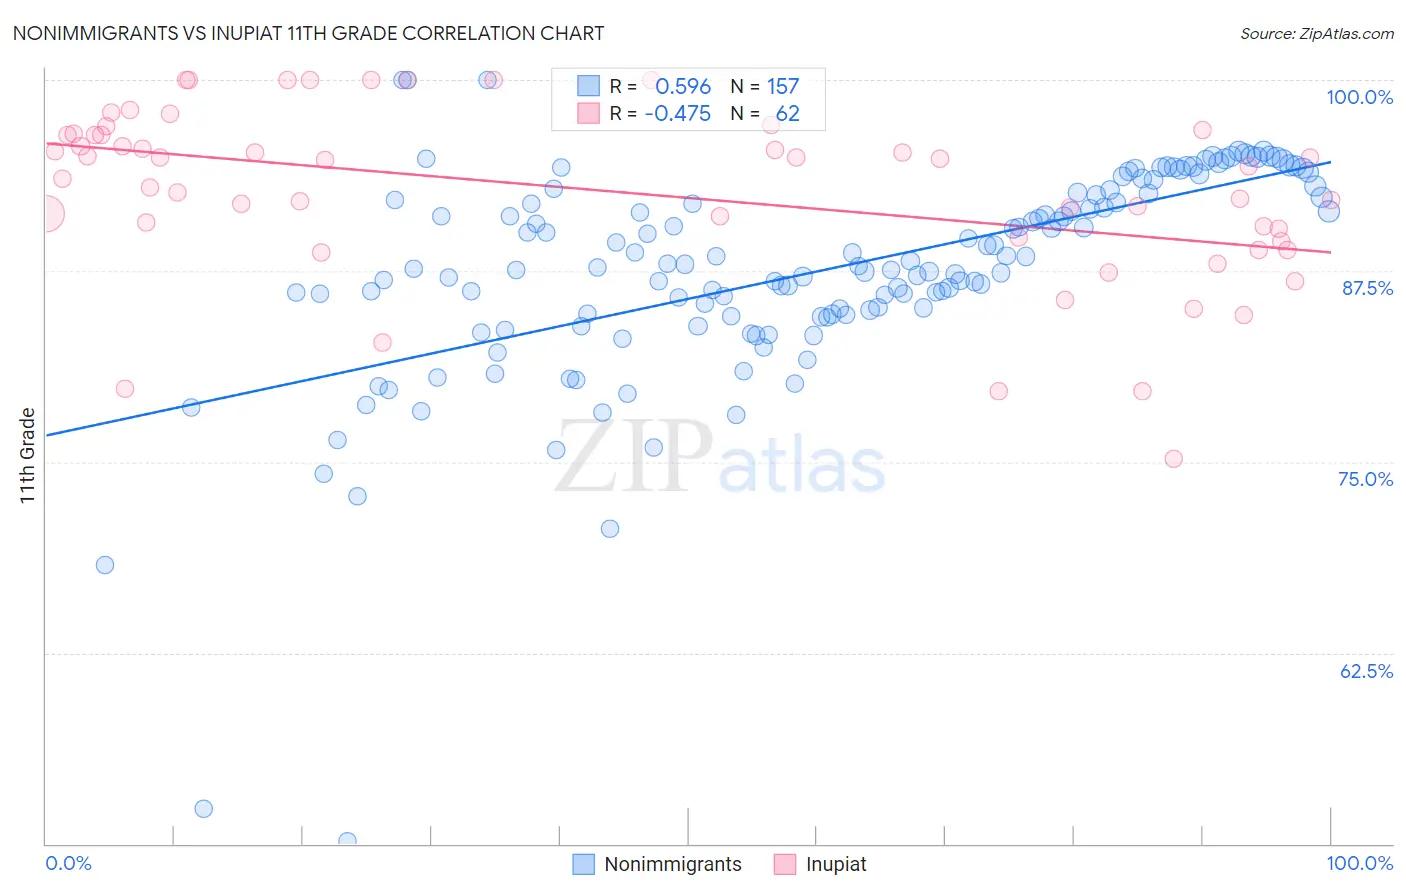
Nonimmigrants vs Inupiat 11th Grade Correlation Chart
The statistical analysis conducted on geographies consisting of 585,371,149 people shows a substantial positive correlation between the proportion of Nonimmigrants and percentage of population with at least 11th grade education in the United States with a correlation coefficient (R) of 0.596 and weighted average of 92.7%. Similarly, the statistical analysis conducted on geographies consisting of 96,349,180 people shows a moderate negative correlation between the proportion of Inupiat and percentage of population with at least 11th grade education in the United States with a correlation coefficient (R) of -0.475 and weighted average of 92.4%, a difference of 0.26%.
11th Grade Correlation Summary
| Measurement | Nonimmigrants | Inupiat |
| Minimum | 50.2% | 75.2% |
| Maximum | 100.0% | 100.0% |
| Range | 49.8% | 24.8% |
| Mean | 87.5% | 92.7% |
| Median | 87.8% | 94.5% |
| Interquartile 25% (IQ1) | 84.6% | 89.7% |
| Interquartile 75% (IQ3) | 92.5% | 96.4% |
| Interquartile Range (IQR) | 7.9% | 6.7% |
| Standard Deviation (Sample) | 7.1% | 5.7% |
| Standard Deviation (Population) | 7.1% | 5.6% |
Demographics Similar to Nonimmigrants and Inupiat by 11th Grade
In terms of 11th grade, the demographic groups most similar to Nonimmigrants are Spanish (92.7%, a difference of 0.0%), Paraguayan (92.7%, a difference of 0.020%), Immigrants from Iraq (92.6%, a difference of 0.030%), Immigrants from Argentina (92.7%, a difference of 0.040%), and Bermudan (92.6%, a difference of 0.050%). Similarly, the demographic groups most similar to Inupiat are Creek (92.4%, a difference of 0.0%), Cherokee (92.4%, a difference of 0.0%), Sudanese (92.5%, a difference of 0.030%), Guamanian/Chamorro (92.5%, a difference of 0.040%), and Spaniard (92.5%, a difference of 0.060%).
| Demographics | Rating | Rank | 11th Grade |
| Immigrants | Argentina | 69.8 /100 | #161 | Good 92.7% |
| Paraguayans | 68.7 /100 | #162 | Good 92.7% |
| Immigrants | Nonimmigrants | 66.6 /100 | #163 | Good 92.7% |
| Spanish | 66.2 /100 | #164 | Good 92.7% |
| Immigrants | Iraq | 63.7 /100 | #165 | Good 92.6% |
| Bermudans | 62.3 /100 | #166 | Good 92.6% |
| Alsatians | 60.2 /100 | #167 | Good 92.6% |
| Sierra Leoneans | 58.7 /100 | #168 | Average 92.6% |
| Immigrants | Albania | 57.8 /100 | #169 | Average 92.6% |
| Immigrants | Northern Africa | 57.3 /100 | #170 | Average 92.6% |
| Laotians | 54.4 /100 | #171 | Average 92.6% |
| Immigrants | Pakistan | 52.3 /100 | #172 | Average 92.5% |
| Indians (Asian) | 51.5 /100 | #173 | Average 92.5% |
| Asians | 50.0 /100 | #174 | Average 92.5% |
| Shoshone | 48.9 /100 | #175 | Average 92.5% |
| Spaniards | 46.9 /100 | #176 | Average 92.5% |
| Guamanians/Chamorros | 45.0 /100 | #177 | Average 92.5% |
| Sudanese | 43.4 /100 | #178 | Average 92.5% |
| Creek | 40.9 /100 | #179 | Average 92.4% |
| Inupiat | 40.7 /100 | #180 | Average 92.4% |
| Cherokee | 40.7 /100 | #181 | Average 92.4% |