Nonimmigrants vs Choctaw 10th Grade
COMPARE
Nonimmigrants
Choctaw
10th Grade
10th Grade Comparison
Nonimmigrants
Choctaw
94.1%
10TH GRADE
83.8/ 100
METRIC RATING
145th/ 347
METRIC RANK
93.6%
10TH GRADE
36.6/ 100
METRIC RATING
184th/ 347
METRIC RANK
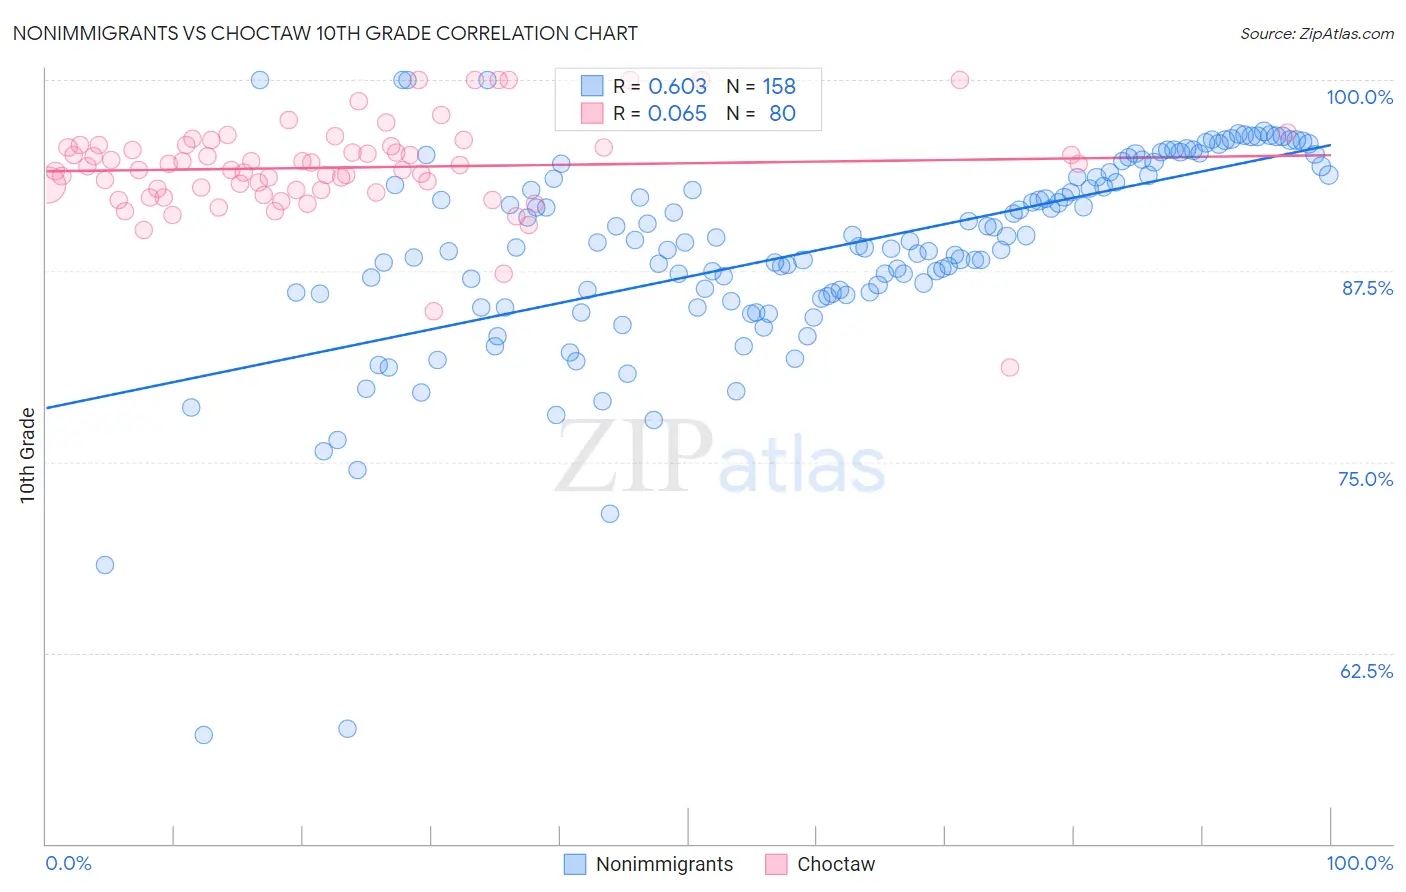
Nonimmigrants vs Choctaw 10th Grade Correlation Chart
The statistical analysis conducted on geographies consisting of 585,371,970 people shows a significant positive correlation between the proportion of Nonimmigrants and percentage of population with at least 10th grade education in the United States with a correlation coefficient (R) of 0.603 and weighted average of 94.1%. Similarly, the statistical analysis conducted on geographies consisting of 269,742,499 people shows a slight positive correlation between the proportion of Choctaw and percentage of population with at least 10th grade education in the United States with a correlation coefficient (R) of 0.065 and weighted average of 93.6%, a difference of 0.49%.
10th Grade Correlation Summary
| Measurement | Nonimmigrants | Choctaw |
| Minimum | 57.2% | 81.1% |
| Maximum | 100.0% | 100.0% |
| Range | 42.8% | 18.9% |
| Mean | 88.9% | 94.3% |
| Median | 89.2% | 94.4% |
| Interquartile 25% (IQ1) | 86.0% | 92.8% |
| Interquartile 75% (IQ3) | 93.8% | 95.7% |
| Interquartile Range (IQR) | 7.8% | 2.9% |
| Standard Deviation (Sample) | 6.8% | 3.1% |
| Standard Deviation (Population) | 6.8% | 3.1% |
Similar Demographics by 10th Grade
Demographics Similar to Nonimmigrants by 10th Grade
In terms of 10th grade, the demographic groups most similar to Nonimmigrants are Cherokee (94.1%, a difference of 0.020%), Immigrants from Kazakhstan (94.1%, a difference of 0.020%), Chickasaw (94.1%, a difference of 0.020%), Immigrants from Ukraine (94.0%, a difference of 0.040%), and Arab (94.0%, a difference of 0.040%).
| Demographics | Rating | Rank | 10th Grade |
| Immigrants | Sri Lanka | 89.9 /100 | #138 | Excellent 94.2% |
| Immigrants | Bosnia and Herzegovina | 89.4 /100 | #139 | Excellent 94.2% |
| Immigrants | Jordan | 87.6 /100 | #140 | Excellent 94.1% |
| Hmong | 86.6 /100 | #141 | Excellent 94.1% |
| Albanians | 86.5 /100 | #142 | Excellent 94.1% |
| Cherokee | 84.9 /100 | #143 | Excellent 94.1% |
| Immigrants | Kazakhstan | 84.9 /100 | #144 | Excellent 94.1% |
| Immigrants | Nonimmigrants | 83.8 /100 | #145 | Excellent 94.1% |
| Chickasaw | 82.6 /100 | #146 | Excellent 94.1% |
| Immigrants | Ukraine | 81.5 /100 | #147 | Excellent 94.0% |
| Arabs | 80.9 /100 | #148 | Excellent 94.0% |
| Ugandans | 80.7 /100 | #149 | Excellent 94.0% |
| Egyptians | 79.6 /100 | #150 | Good 94.0% |
| Kenyans | 79.1 /100 | #151 | Good 94.0% |
| Immigrants | Italy | 78.0 /100 | #152 | Good 94.0% |
Demographics Similar to Choctaw by 10th Grade
In terms of 10th grade, the demographic groups most similar to Choctaw are Guamanian/Chamorro (93.6%, a difference of 0.0%), Sudanese (93.6%, a difference of 0.0%), Colville (93.6%, a difference of 0.020%), Immigrants from Eastern Asia (93.6%, a difference of 0.020%), and Liberian (93.6%, a difference of 0.020%).
| Demographics | Rating | Rank | 10th Grade |
| Immigrants | Lebanon | 47.1 /100 | #177 | Average 93.7% |
| Sierra Leoneans | 46.1 /100 | #178 | Average 93.7% |
| Paraguayans | 45.3 /100 | #179 | Average 93.7% |
| Blackfeet | 42.8 /100 | #180 | Average 93.7% |
| Immigrants | Northern Africa | 41.6 /100 | #181 | Average 93.7% |
| Colville | 38.8 /100 | #182 | Fair 93.6% |
| Guamanians/Chamorros | 37.1 /100 | #183 | Fair 93.6% |
| Choctaw | 36.6 /100 | #184 | Fair 93.6% |
| Sudanese | 36.6 /100 | #185 | Fair 93.6% |
| Immigrants | Eastern Asia | 35.1 /100 | #186 | Fair 93.6% |
| Liberians | 34.7 /100 | #187 | Fair 93.6% |
| Marshallese | 33.2 /100 | #188 | Fair 93.6% |
| Immigrants | Pakistan | 32.5 /100 | #189 | Fair 93.6% |
| Laotians | 32.1 /100 | #190 | Fair 93.6% |
| Yup'ik | 31.1 /100 | #191 | Fair 93.6% |