Nigerian vs Northern European Doctorate Degree
COMPARE
Nigerian
Northern European
Doctorate Degree
Doctorate Degree Comparison
Nigerians
Northern Europeans
1.8%
DOCTORATE DEGREE
39.9/ 100
METRIC RATING
184th/ 347
METRIC RANK
2.2%
DOCTORATE DEGREE
99.7/ 100
METRIC RATING
79th/ 347
METRIC RANK
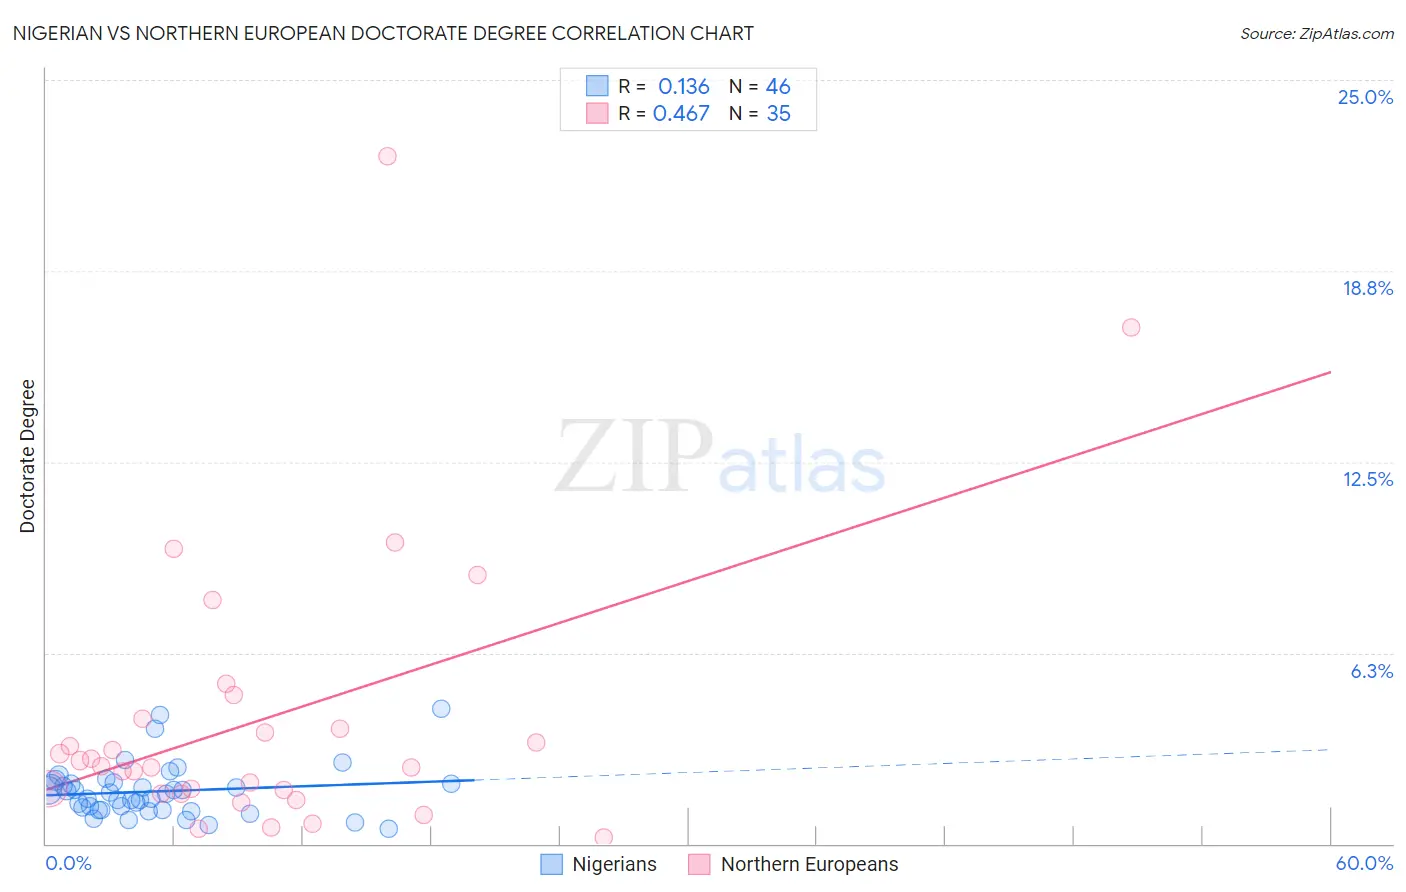
Nigerian vs Northern European Doctorate Degree Correlation Chart
The statistical analysis conducted on geographies consisting of 330,548,199 people shows a poor positive correlation between the proportion of Nigerians and percentage of population with at least doctorate degree education in the United States with a correlation coefficient (R) of 0.136 and weighted average of 1.8%. Similarly, the statistical analysis conducted on geographies consisting of 401,433,855 people shows a moderate positive correlation between the proportion of Northern Europeans and percentage of population with at least doctorate degree education in the United States with a correlation coefficient (R) of 0.467 and weighted average of 2.2%, a difference of 23.3%.
Doctorate Degree Correlation Summary
| Measurement | Nigerian | Northern European |
| Minimum | 0.50% | 0.22% |
| Maximum | 4.4% | 22.5% |
| Range | 3.9% | 22.3% |
| Mean | 1.7% | 4.1% |
| Median | 1.7% | 2.5% |
| Interquartile 25% (IQ1) | 1.1% | 1.6% |
| Interquartile 75% (IQ3) | 2.0% | 4.1% |
| Interquartile Range (IQR) | 0.87% | 2.5% |
| Standard Deviation (Sample) | 0.84% | 4.7% |
| Standard Deviation (Population) | 0.83% | 4.6% |
Similar Demographics by Doctorate Degree
Demographics Similar to Nigerians by Doctorate Degree
In terms of doctorate degree, the demographic groups most similar to Nigerians are Finnish (1.8%, a difference of 0.33%), Slovak (1.8%, a difference of 0.57%), Immigrants from Afghanistan (1.8%, a difference of 0.66%), Peruvian (1.8%, a difference of 0.89%), and Immigrants (1.8%, a difference of 0.96%).
| Demographics | Rating | Rank | Doctorate Degree |
| Iraqis | 49.2 /100 | #177 | Average 1.8% |
| French | 48.8 /100 | #178 | Average 1.8% |
| Ghanaians | 48.3 /100 | #179 | Average 1.8% |
| Scandinavians | 48.0 /100 | #180 | Average 1.8% |
| Immigrants | Immigrants | 46.2 /100 | #181 | Average 1.8% |
| Immigrants | Afghanistan | 44.3 /100 | #182 | Average 1.8% |
| Finns | 42.1 /100 | #183 | Average 1.8% |
| Nigerians | 39.9 /100 | #184 | Fair 1.8% |
| Slovaks | 36.4 /100 | #185 | Fair 1.8% |
| Peruvians | 34.4 /100 | #186 | Fair 1.8% |
| Czechoslovakians | 33.0 /100 | #187 | Fair 1.8% |
| Germans | 30.5 /100 | #188 | Fair 1.8% |
| French Canadians | 30.2 /100 | #189 | Fair 1.8% |
| Immigrants | Costa Rica | 30.2 /100 | #190 | Fair 1.8% |
| South Americans | 29.5 /100 | #191 | Fair 1.8% |
Demographics Similar to Northern Europeans by Doctorate Degree
In terms of doctorate degree, the demographic groups most similar to Northern Europeans are Immigrants from Belarus (2.2%, a difference of 0.070%), Ugandan (2.2%, a difference of 0.28%), Immigrants from Argentina (2.2%, a difference of 0.34%), Immigrants from Lebanon (2.2%, a difference of 0.59%), and Immigrants from Hungary (2.2%, a difference of 0.60%).
| Demographics | Rating | Rank | Doctorate Degree |
| Immigrants | Canada | 99.8 /100 | #72 | Exceptional 2.3% |
| Immigrants | Bulgaria | 99.8 /100 | #73 | Exceptional 2.3% |
| Immigrants | North America | 99.8 /100 | #74 | Exceptional 2.2% |
| Immigrants | Western Asia | 99.8 /100 | #75 | Exceptional 2.2% |
| Immigrants | Hungary | 99.8 /100 | #76 | Exceptional 2.2% |
| Immigrants | Lebanon | 99.8 /100 | #77 | Exceptional 2.2% |
| Immigrants | Belarus | 99.7 /100 | #78 | Exceptional 2.2% |
| Northern Europeans | 99.7 /100 | #79 | Exceptional 2.2% |
| Ugandans | 99.7 /100 | #80 | Exceptional 2.2% |
| Immigrants | Argentina | 99.7 /100 | #81 | Exceptional 2.2% |
| Immigrants | Uganda | 99.6 /100 | #82 | Exceptional 2.2% |
| Immigrants | Lithuania | 99.6 /100 | #83 | Exceptional 2.2% |
| Immigrants | England | 99.6 /100 | #84 | Exceptional 2.2% |
| Immigrants | Brazil | 99.6 /100 | #85 | Exceptional 2.2% |
| Egyptians | 99.4 /100 | #86 | Exceptional 2.2% |